Your site stops loading after a plugin update. Mail suddenly won't connect. A firewall change looked simple, but now a service that worked yesterday has gone quiet. In that moment, you don't need a theory-heavy networking lecture. You need a fast way to see what your server is doing.
That's where the Netstat -a command still earns its place. It's old, but it's useful. On a VPS, a Windows server, or a Mac you're using for checks, it gives you a quick inventory of open listening ports and live connections so you can stop guessing and start verifying.
For Australian developers, small business owners, and hosting customers, that matters because most outages aren't mysterious. Usually, a service isn't listening, a port isn't bound where you expected, or a connection state is being misread. The command won't solve every problem on its own, but it's often the fastest first step.
Table of Contents
- What Is the Netstat Command and Why Does It Matter
- Running Netstat -a on Windows Linux and macOS
- Decoding Connection States and Port Numbers
- Practical Troubleshooting with Netstat Flags
- Using Netstat for Security Audits on Your VPS
- When to Use ss or lsof Instead of Netstat

Performance you can feel, backed by clients who depend on it. Read how our support and uptime create long‑term customer success.Power Your Business with Better Hosting
What Is the Netstat Command and Why Does It Matter
The Netstat -a command is a long-standing network diagnostics tool on Unix and Linux that shows all active connections and listening ports. Its roots sit in the same broad family of system visibility tools used in enterprise administration for years, and Oracle notes that related network statistics services such as rpc.rstatd have existed since the initial release of Solaris in its administration history, which shows how deep this style of command-line monitoring runs in established environments (Oracle Solaris administration reference).

That history matters because many real hosting environments aren't clean-sheet builds. They include older scripts, mixed operating systems, appliances, and admin runbooks that still rely on netstat -a. Even when a newer tool is available, the old output format remains familiar enough that it's often the quickest way to confirm whether a service is listening and whether clients are connecting.
For a practical hosting workflow, think of netstat as a map of the server's front doors and current visitors. If your site feels down, you can check whether the web service is listening. If a firewall rule was changed, you can check whether the intended port is active. If an application restart supposedly succeeded, you can confirm whether it bound to the right interface.
Practical rule: Don't treat netstat as proof that everything is healthy. Treat it as proof of what is listening, what is connected, and what deserves your next check.
It's also useful from a security angle. If you're reviewing exposed services, start with what's listening before you dive into logs or packet captures. That's one reason server owners often combine quick command-line checks with broader guidance around small business network security.
Running Netstat -a on Windows Linux and macOS
You don't need a full monitoring stack to start. You just need a shell and the right expectation. Run the command, then look first at protocol, local address, foreign address, and state.
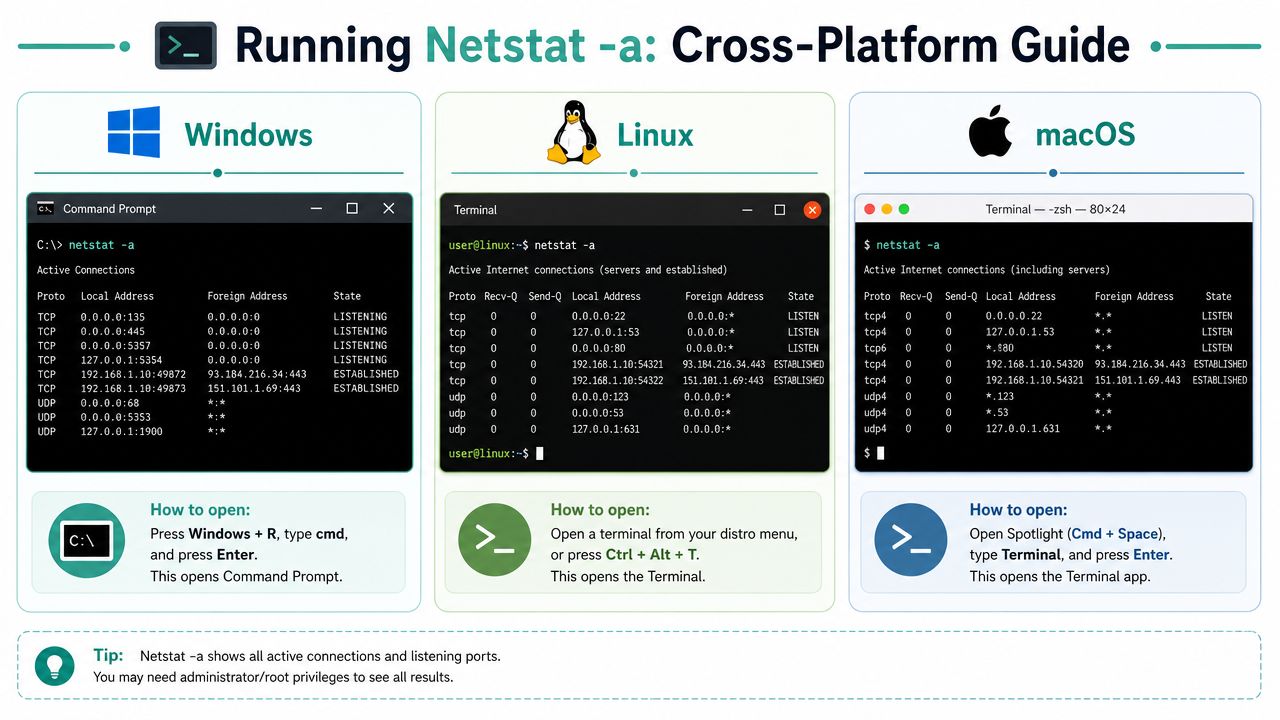
Windows
Open Command Prompt or PowerShell, then run:
netstat -a
You'll usually see columns similar to these:
| Proto | Local Address | Foreign Address | State |
|---|---|---|---|
| TCP | server:80 | remote-client:random | ESTABLISHED |
| TCP | server:443 | 0.0.0.0:0 | LISTENING |
| UDP | server:53 | : |
On Windows, this is a strong first look when a service won't respond after a change. If Remote Desktop, mail, or a web app isn't reachable, netstat -a tells you whether the service is listening before you spend time blaming the network.
Linux
Open a terminal session locally or connect over SSH, then run:
netstat -a
On some Linux systems, especially minimal VPS builds, netstat may not be installed by default. If the command isn't present, that usually means the machine has moved toward newer tooling and you'll use ss instead, which I cover later.
Typical output looks like:
| Proto | Recv-Q | Send-Q | Local Address | Foreign Address | State |
|---|---|---|---|---|---|
| tcp | 0 | 0 | server:ssh | 0.0.0.0:* | LISTEN |
| tcp | 0 | 0 | server:https | remote-client:random | ESTABLISHED |
| udp | 0 | 0 | server:domain | 0.0.0.0:* |
If you're managing a VPS and need shell access before you can run checks, this VPS login guide is the kind of practical reference worth keeping handy.
macOS
Open Terminal and run:
netstat -a
macOS output is a bit different in style, but the idea is the same. You're looking for sockets that are listening, connections that are established, and anything unexpected.
The first pass is simple. Run the command, ignore the noise, and find the service you care about first.
A good way to stay sane is to start with one question only. Is the web server listening. Is the database listening locally. Is there an active connection to the service right now. That keeps the output useful instead of overwhelming.
Host your website with our 5-star rated, cPanel website hosting plans.
Super fast servers, with security included and hosted in your choice of Australian Data Center.
View cPanel Plans
Decoding Connection States and Port Numbers
Once the command returns data, the hard part isn't collecting it. The hard part is interpreting it without jumping to the wrong conclusion. On Windows and Unix systems, netstat -a is best used as a first-pass inventory of live TCP and UDP endpoints before deeper inspection, and a reliable workflow is to confirm the local address and port, then compare the state with the service process or startup log. That matters because transient states such as TIME_WAIT and CLOSE_WAIT can look alarming but aren't, by themselves, proof of compromise or outage (Broadcom TCP/IP quick reference).
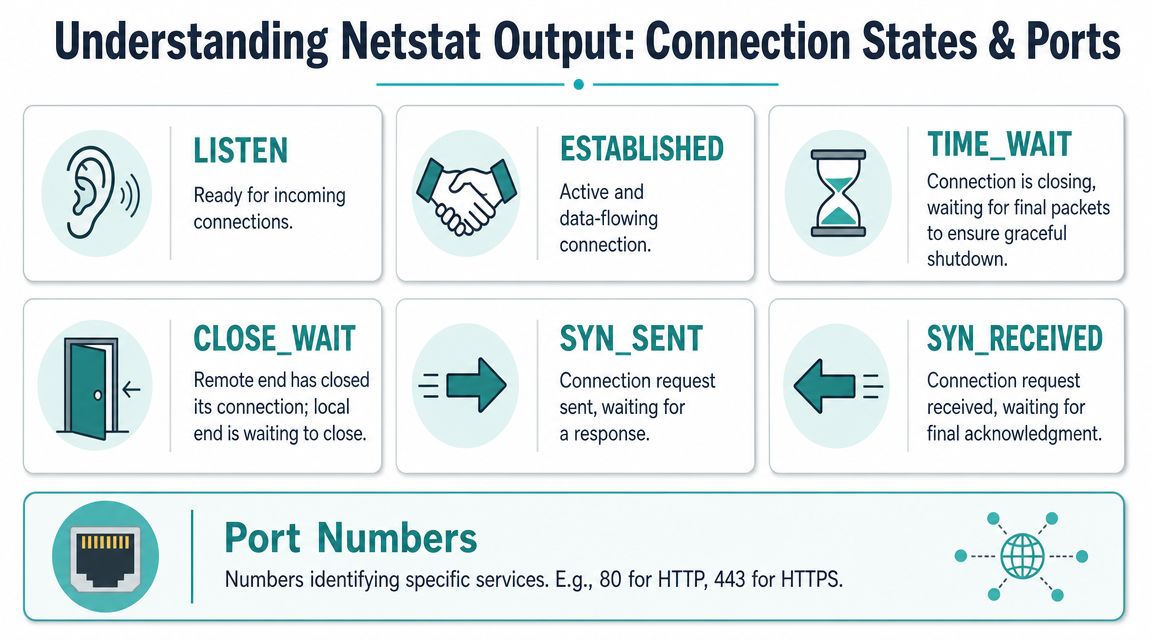
What the common states mean
Think of states as a snapshot of a conversation.
- LISTEN or LISTENING means the service is waiting for inbound connections. For a website, this is the door being open.
- ESTABLISHED means traffic is actively flowing between two endpoints.
- TIME_WAIT usually means a connection has recently closed and the system is waiting for the shutdown to complete cleanly.
- CLOSE_WAIT means the remote side has closed first, while the local side still needs to finish its part of the shutdown.
- SYN_SENT often means the server or application has tried to start a connection and is waiting for a reply.
- SYN_RECEIVED usually means a connection request arrived and the final handshake step is still pending.
A lot of unnecessary panic starts with TIME_WAIT. On a busy web or mail server, seeing that state after short-lived connections is normal. The better question is whether the expected service is listening and whether clients can form fresh established sessions.
Don't diagnose an attack or outage from one scary-looking state alone. Match the state to the service, then check logs and process ownership.
Ports that matter on a hosted server
You don't need to memorise every port, but you should recognise the common ones that affect daily hosting work.
| Port | Typical service | Why you care |
|---|---|---|
| 80 | HTTP | Basic website traffic |
| 443 | HTTPS | Secure website traffic |
| 25 | SMTP | Outbound or server mail flow |
| 143 | IMAP | Mail client access |
| 3306 | MySQL or MariaDB | Database access, often local only |
If you want a broader refresher on service mappings, this practical guide to network ports is a useful companion when you're translating raw port numbers into real services.
For hosted websites, another helpful habit is checking whether the traffic you expect is reaching the web server. A related admin task often involves finding IPs hitting your webserver, especially when you're comparing active sessions with access logs.
Practical Troubleshooting with Netstat Flags
netstat -a is a strong starting point, but it doesn't answer every operational question. Microsoft's documentation pairs -a with flags such as -o, -n, and an interval for better troubleshooting, while Linux guidance increasingly treats netstat as deprecated in favour of ss. The practical gap is simple. If you only run netstat -a, you often still won't know which application owns a suspicious port or whether name resolution is hiding what you need to see (Microsoft netstat command reference).

Find the process behind a port
A common support scenario goes like this. A service won't start because the port is already in use, but nobody knows by what.
On Windows, use:
netstat -ano
This adds numeric output and the PID, which lets you match the port to a process in Task Manager or with tasklist.
On Linux, a common pattern is:
netstat -anp
That adds process information where permissions allow it. If a web server restart fails because another service grabbed the port first, this is usually the quickest clue.
For a real-world troubleshooting mindset, I like resources that focus on sequence rather than theory. Finchum's write-up on network support troubleshooting steps is a good example of the broader discipline. Verify the symptom, isolate the layer, then confirm the process behind the connection.
Filter noisy output fast
Raw netstat output can be messy on a busy server. Filtering is what turns it into a usable tool.
On Windows, search for a specific port:
netstat -ano | findstr :443
On Linux or macOS, the equivalent pattern is:
netstat -an | grep :443
That works well when:
- A website feels down and you want to see whether HTTPS is listening.
- A database app won't connect and you want to check whether the database port appears at all.
- A firewall change was made and you need to confirm whether the service is bound to the expected port after restart.
A filtered command is often more useful than a clever command. Start narrow and confirm one service at a time.
If users report browser errors after resets or interrupted sessions, it also helps to compare your connection states with the application layer. This kind of issue often overlaps with browser-side troubleshooting such as diagnosing ERR_CONNECTION_RESET.
Using Netstat for Security Audits on Your VPS
Troubleshooting is reactive. Security auditing is preventive. The Netstat -a command is useful for both because it gives you a straightforward view of which services are exposed and which connections are active right now.
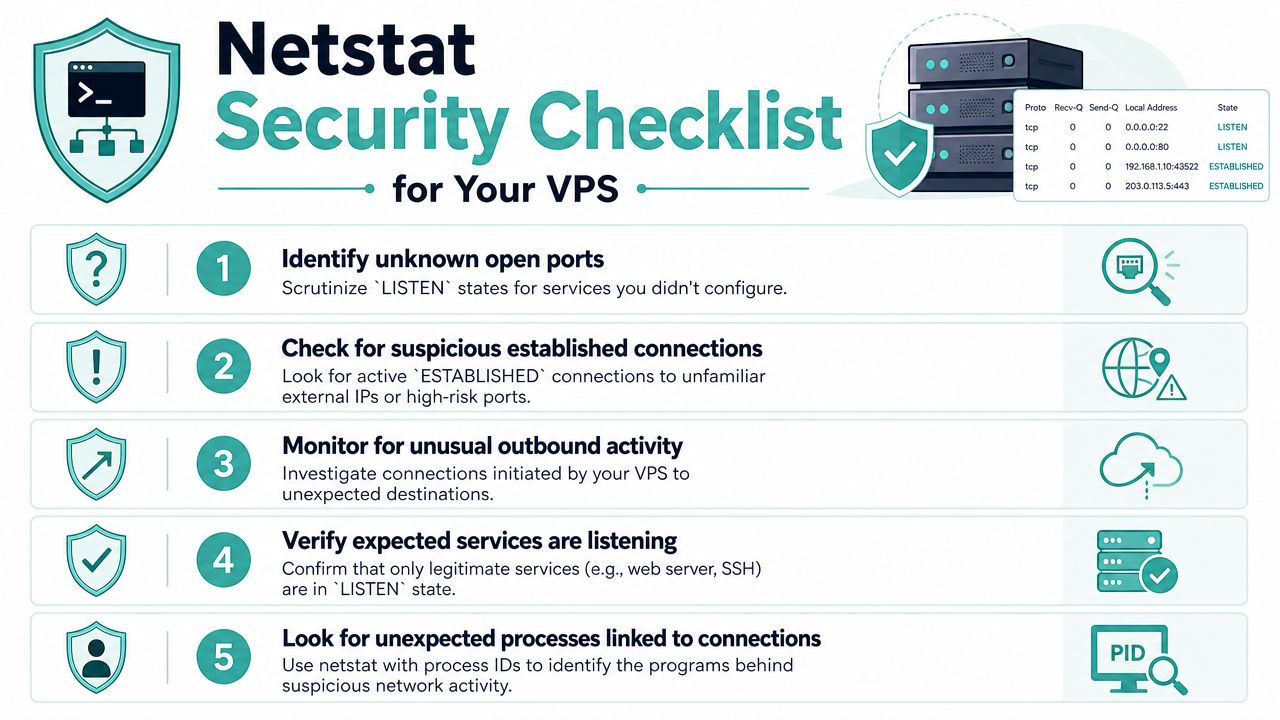
A simple audit routine
When I'm doing a quick sanity check on a VPS, I don't start with fancy tooling. I start with the basics.
- Review listening services first. If a service is in
LISTENorLISTENING, ask whether you knowingly installed it and whether it should be reachable. - Look at established sessions next. Active connections aren't bad on their own, but they should make sense for the server's role.
- Check outbound activity as well. Suspicious outbound connections can matter just as much as inbound ones.
- Compare findings with intended roles. A web server, mail server, and database server should each have different expected patterns.
This matters on self-managed hosting because accidental exposure is common. A test service gets installed and forgotten. A panel add-on opens a socket you didn't expect. A mail-related process starts talking when no one remembers enabling it.
What deserves follow-up
Not every unusual line is a crisis. Some things are normal, especially on a server that handles web and mail traffic all day. What deserves closer attention is anything that doesn't fit the server's purpose.
Use follow-up checks when you see:
| Finding | Why it matters | Next step |
|---|---|---|
| Unknown listening service | It may be unnecessary or misconfigured | Identify the process and review startup config |
| Unexpected established session | It may indicate software behaviour you didn't intend | Check the owning process and related logs |
| Repeated outbound connections | It can suggest abuse, automation, or a broken integration | Review application tasks and mail activity |
For cPanel systems, unwanted outbound behaviour is one of the first things to investigate when mail reputation or abuse issues appear. In these instances, a practical reference like tracking down a spammer on cPanel proves useful alongside netstat output.
Register your new domain name at competitive market prices including free domain add-ons like privacy, DNS Hosting, Custom Nameservers and Forwarding.
Always the best price and no nasty renewal price hikes.
Register A Domain Name
When to Use ss or lsof Instead of Netstat
On modern Linux systems, netstat is increasingly treated as a legacy tool and ss is commonly recommended instead. Current Linux operations guidance explicitly positions ss -tuln as the replacement for checking listening TCP and UDP sockets, and also gives examples such as ss -tunap | grep :80 or ss -t state established | grep :443 | wc -l for active connection checks, which shows how operational practice has shifted as systems scaled (modern Linux monitoring guidance).
Use ss for speed
If you're working on a busier Linux server, ss is usually the better first choice.
Use it when you need:
- faster socket inspection
- cleaner output on modern distributions
- a current tool that aligns with present-day admin practice
A few handy equivalents:
| Task | Netstat style | Modern alternative |
|---|---|---|
| Show listening sockets | netstat -a | ss -tuln |
| Check activity on web port | filtered netstat output | ss -tunap | grep :80 |
| Review established HTTPS sessions | filtered netstat states | ss -t state established | grep :443 | wc -l |
Use lsof for process detail
Use lsof when the question is less about sockets and more about ownership. If you need to know which program has a specific port open, lsof is often clearer than netstat output.
That's the honest position in 2026. Netstat -a still matters because it's portable knowledge, familiar in older runbooks, and useful in mixed environments. But if you're on a current Linux build and need speed or sharper process detail, ss and lsof are usually the stronger tools.
If you'd rather spend less time diagnosing server issues on your own, UpTime Web Hosting offers Australian hosting and managed VPS options backed by local support. Whether you're running a small business site, WordPress install, Windows app, or mail service, having responsive hosting close to home makes day-to-day troubleshooting much easier.