In short
Server monitoring as a service means an external provider watches agreed server, network, application and website signals, then follows a defined response process when a threshold or outage is detected. The useful part is not the dashboard alone. It is clear ownership of triage, escalation, approved remediation and reporting.
Key takeaways
- A useful monitoring scope combines external availability checks with internal server metrics, service checks and relevant logs.
- Monitoring around the clock does not automatically mean a technician will respond or make changes around the clock.
- Every critical alert needs a severity, an owner, a notification route, an acknowledgement target and a documented next action.
- A provider can only repair faults when access, authority, change controls and third-party responsibilities have been agreed.
- Reports should expose repeat incidents, noisy alerts, capacity risks, monitoring gaps and unfinished corrective work.
Table of contents
- What does server monitoring as a service actually include?
- What should a provider monitor?
- What happens when an alert fires?
- Who owns the alert, the investigation and the fix?
- How should alerts be prioritised and escalated?
- What should be agreed before monitoring starts?
- How do you tell if the service is working?
- How is a managed service different from monitoring software?
- What else do businesses ask about server monitoring?
- Is server monitoring as a service right for your business?
A server monitoring dashboard can show that something has gone wrong. It cannot decide who should wake up, who may restart a service, who contacts an application vendor or who tells staff that a business system is unavailable.
Those decisions are the core of managed server monitoring. For a business without continuous infrastructure staffing, the commercial value lies in connecting technical signals to an agreed human response.
What does server monitoring as a service actually include?
Server monitoring as a service means an external provider operates agreed monitoring checks and the process around them. The scope may stop at alerting, or it may extend to triage, escalation, approved remediation and reporting.
The monitored system might be a physical server, virtual machine, hosted server, network device, web server, database or application dependency. The service can collect internal metrics through an agent or management interface, test availability from outside the environment, inspect logs and route alerts through a ticketing or on-call process.
As of August 2026, the UpTime Networks monitoring page describes 24×7 monitoring and reporting for networks, servers and websites. That public summary does not publish acknowledgement targets or standard remediation permissions, so those points need to be confirmed during scoping.
Do not read 24×7 monitoring as an automatic promise of 24×7 repair. It may describe the hours during which automated checks operate, while human response, investigation and change work follow a different schedule.
A clear service description assigns four verbs:
- Detect: Which conditions will the monitoring system identify?
- Acknowledge: Who confirms that the alert has been received?
- Investigate: Who checks impact, dependencies, logs and recent changes?
- Fix: Who has permission and capability to restore the service?
What is the alert-to-action flow?
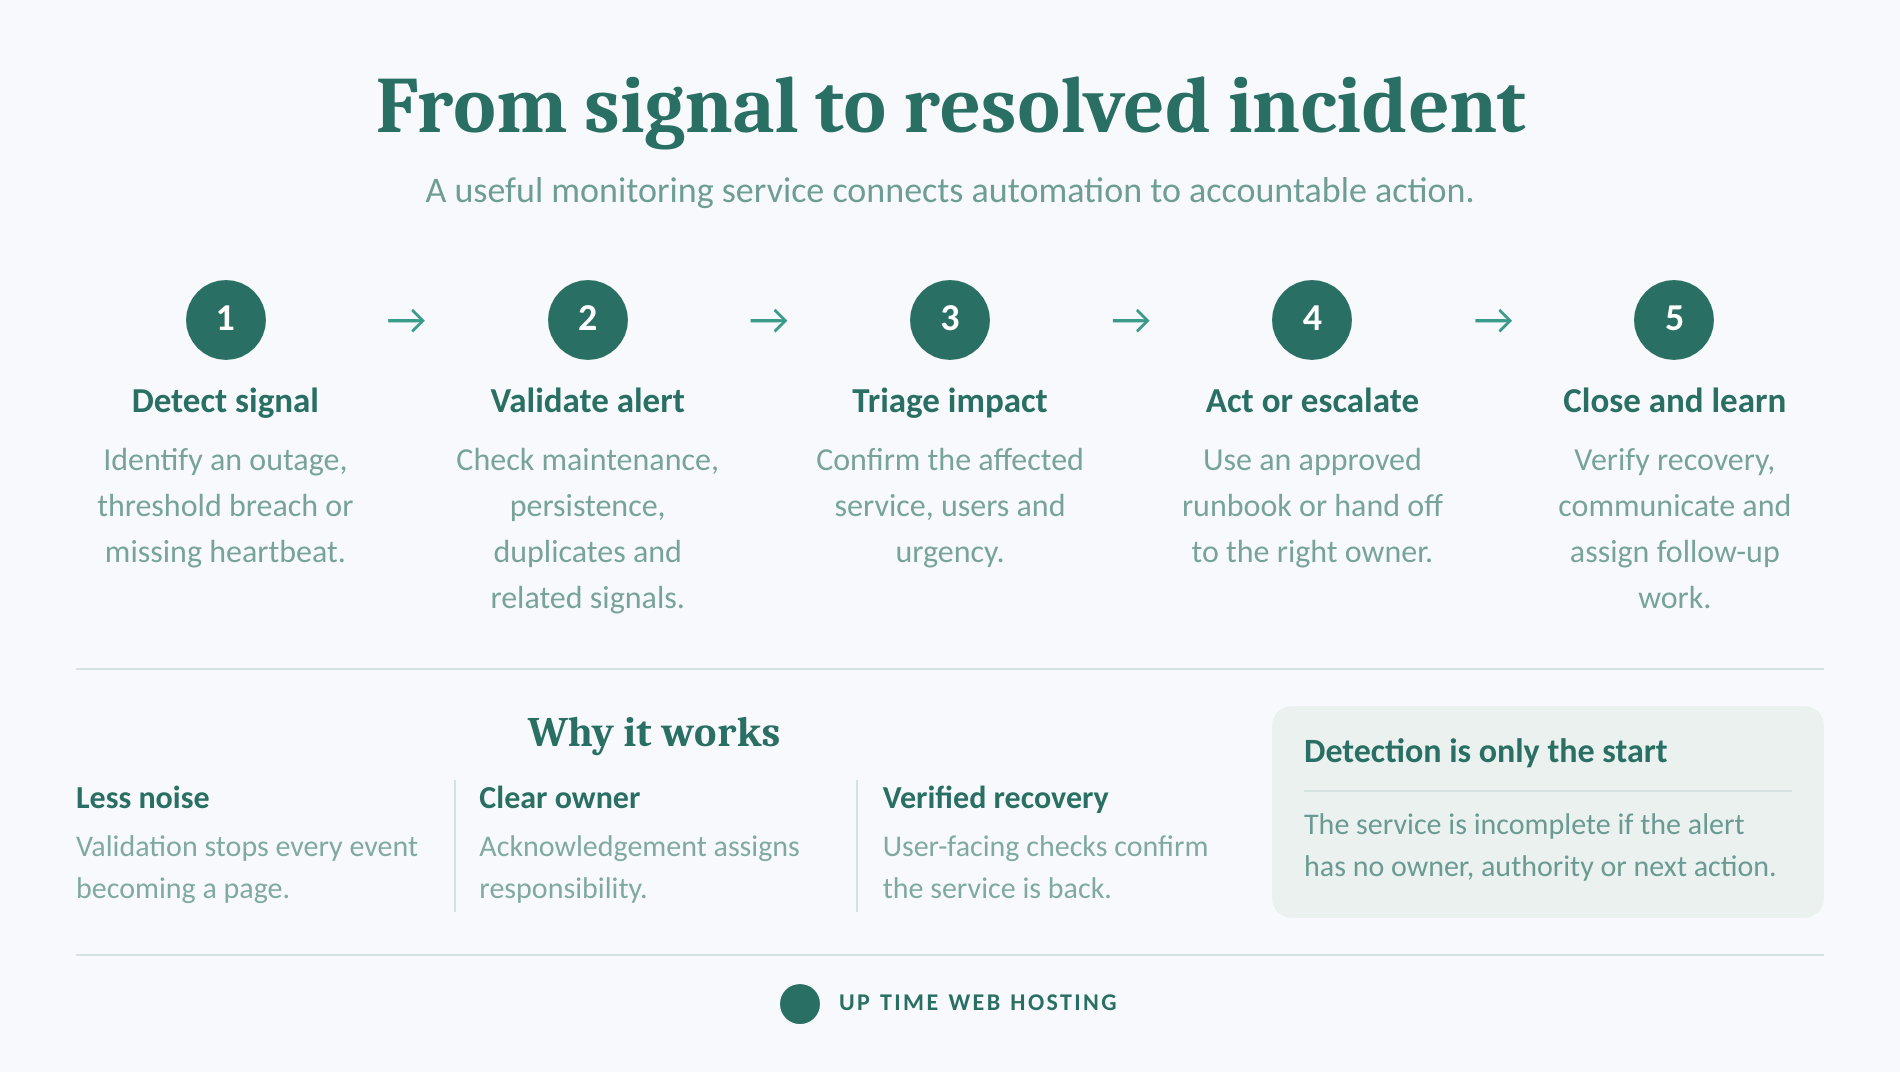
A dependable service moves through five connected stages:
- Detect the signal. A check identifies an outage, error, threshold breach or missing heartbeat.
- Validate the alert. The monitoring process checks maintenance windows, duplicates and related signals before paging a person.
- Triage the impact. The responder identifies the affected service, likely user impact and urgency.
- Act or escalate. An authorised runbook action is performed, or the incident is handed to the correct customer, provider or vendor contact.
- Close and learn. Recovery is verified, communication is completed and repeat faults are assigned follow-up work.
Google's Site Reliability Engineering guidance on monitoring separates immediate alerts from tickets that can wait and records that need no current action. That distinction prevents every event from becoming an after-hours page.
Server monitoring as a service is valuable only when detection is connected to a defined human response.

Performance you can feel, backed by clients who depend on it. Read how our support and uptime create long‑term customer success.Power Your Business with Better Hosting
What should a provider monitor?
A provider should monitor the user-visible service, the server resources supporting it, critical processes and dependencies, relevant events and the monitoring path itself. The exact checks should follow the server's role and business importance rather than a generic template applied to every machine.
Which signals belong in the monitoring scope?
| Monitoring layer | Examples to watch | What it can reveal | Typical next action |
|---|---|---|---|
| External availability | DNS resolution, connection, port, web request, login or transaction check | Users cannot reach the service | Confirm impact, route or restore service |
| Server resources | CPU saturation, memory pressure, disk latency, queue depth and free space | Exhaustion or a developing bottleneck | Investigate workload and capacity |
| Operating system | Reboots, time sync, system errors and critical service state | Host instability or a stopped dependency | Follow the operating-system runbook |
| Application | Response time, error rate, worker state, queues and dependency checks | The server is online but the application is failing | Escalate to the application owner |
| Network | Throughput, interface errors, packet loss and connectivity | Congestion or an unreachable dependency | Check the path, device or carrier |
| Logs and security events | Authentication failures, privilege changes and critical configuration events | Operational faults or possible security activity | Route to the assigned operations or security owner |
| Supporting controls | Backup job result, certificate expiry and storage target availability | Recovery or trust controls may fail when needed | Investigate before protection is lost |
| Monitoring path | Agent heartbeat, collector freshness and notification tests | The environment may have become invisible | Restore monitoring and assess the gap |
External checks answer the user-facing question: can the service be reached and used? Internal checks answer the diagnostic question: what is happening inside the server or application?
Google's Site Reliability Engineering guidance on distributed-system monitoring calls these black-box and white-box monitoring. The guidance recommends alerting on user-visible symptoms while retaining detailed internal metrics for investigation.
For a website or web application, an external request can detect failures that a local process check misses. A broader set of website health checks can also examine response behaviour, certificates and site-level problems rather than assuming that an online server means a healthy website.
Server performance monitoring normally includes processor, memory, disk and network evidence. Microsoft's February 2026 Windows performance guidance gives practical examples such as less than 10 per cent available memory as a warning and more than 80 per cent network interface utilisation as critical. The same guidance says short disk-latency spikes may be tolerable and that workload patterns matter.
That qualification is crucial. A fixed threshold copied from another server may be too sensitive for a busy database or too relaxed for a small system that fails quickly when a filesystem fills. Baselines, growth rates and time remaining before failure are often more useful than a single percentage.
Linux environments need the same coverage even though their counters and collection methods differ. Red Hat's system performance documentation describes recording CPU and memory metrics across hosts so administrators can identify resource and performance bottlenecks.
Network monitoring tools add evidence such as interface utilisation, errors and connectivity. If the question is website demand rather than server condition, traffic monitoring tools answer a different question and should not replace infrastructure checks.
Logs also need a defined place in the service. ASD's Australian Cyber Security Centre's August 2024 event-logging guidance recommends centralised log collection, consistent timestamps, secure storage and a detection strategy focused on relevant threats. The guidance prioritises internet-facing services, underlying server operating systems, administrative changes and authentication activity.
Finally, monitor the monitoring system. Add checks for missing agents, stale data, collector failure, full monitoring storage and test notifications. A green dashboard is not trustworthy if the last successful collection occurred hours ago.
A complete monitoring scope checks user-visible availability, internal server health, logs and the health of the monitoring path itself.
What happens when an alert fires?
A useful alert starts a controlled incident workflow instead of merely sending an email. The workflow should validate the signal, assign ownership, assess impact, perform authorised action or escalation, verify recovery and preserve a record.
A practical alert sequence looks like this:
- The monitoring rule detects a condition. The condition may be a failed external request, stopped service, error-rate increase, resource threshold or missing heartbeat.
- Noise controls are applied. The system checks whether the server is in maintenance, whether the breach has persisted long enough and whether related alerts can be grouped.
- The alert receives context. Useful context includes the asset, service, severity, start time, recent changes, related checks and a link to the runbook.
- A ticket or incident is created. The record establishes ownership and prevents the event from disappearing inside an inbox or chat channel.
- The responder acknowledges it. Acknowledgement confirms that a person or team has taken responsibility. It does not mean the fault has been repaired.
- Impact is checked before cause is assumed. A high CPU alert might be a harmless batch job, a symptom of runaway application work or the reason users are experiencing slow responses.
- The responder acts within authority. The action may be a read-only investigation, an approved restart, a failover, a customer call or an escalation to a specialist.
- Recovery is verified from the user's side. A restarted process is not enough if the application still returns errors.
- The incident is closed with evidence. The record should state what happened, what was done, what was not done and what follow-up remains.
Good alert design avoids jumping directly from a metric to a diagnosis. A failed request is a symptom. The cause could sit in the web service, database, storage, network, certificate, identity service or a recent configuration change.
The responder therefore needs both a fast impact check and enough internal evidence to investigate. If that evidence is unavailable, the service should say who collects it and how the incident is handed over.
An alert is not handled until it has been validated, owned, acted on or escalated, and closed with evidence.
Host your website with our 5-star rated, cPanel website hosting plans.
Super fast servers, with security included and hosted in your choice of Australian Data Center.
View cPanel Plans
Who owns the alert, the investigation and the fix?
The provider and customer should divide responsibility before the first alert occurs. Detection, acknowledgement, diagnosis, approval, technical change and business communication are separate jobs, and they may belong to different people.
Where should each responsibility sit?
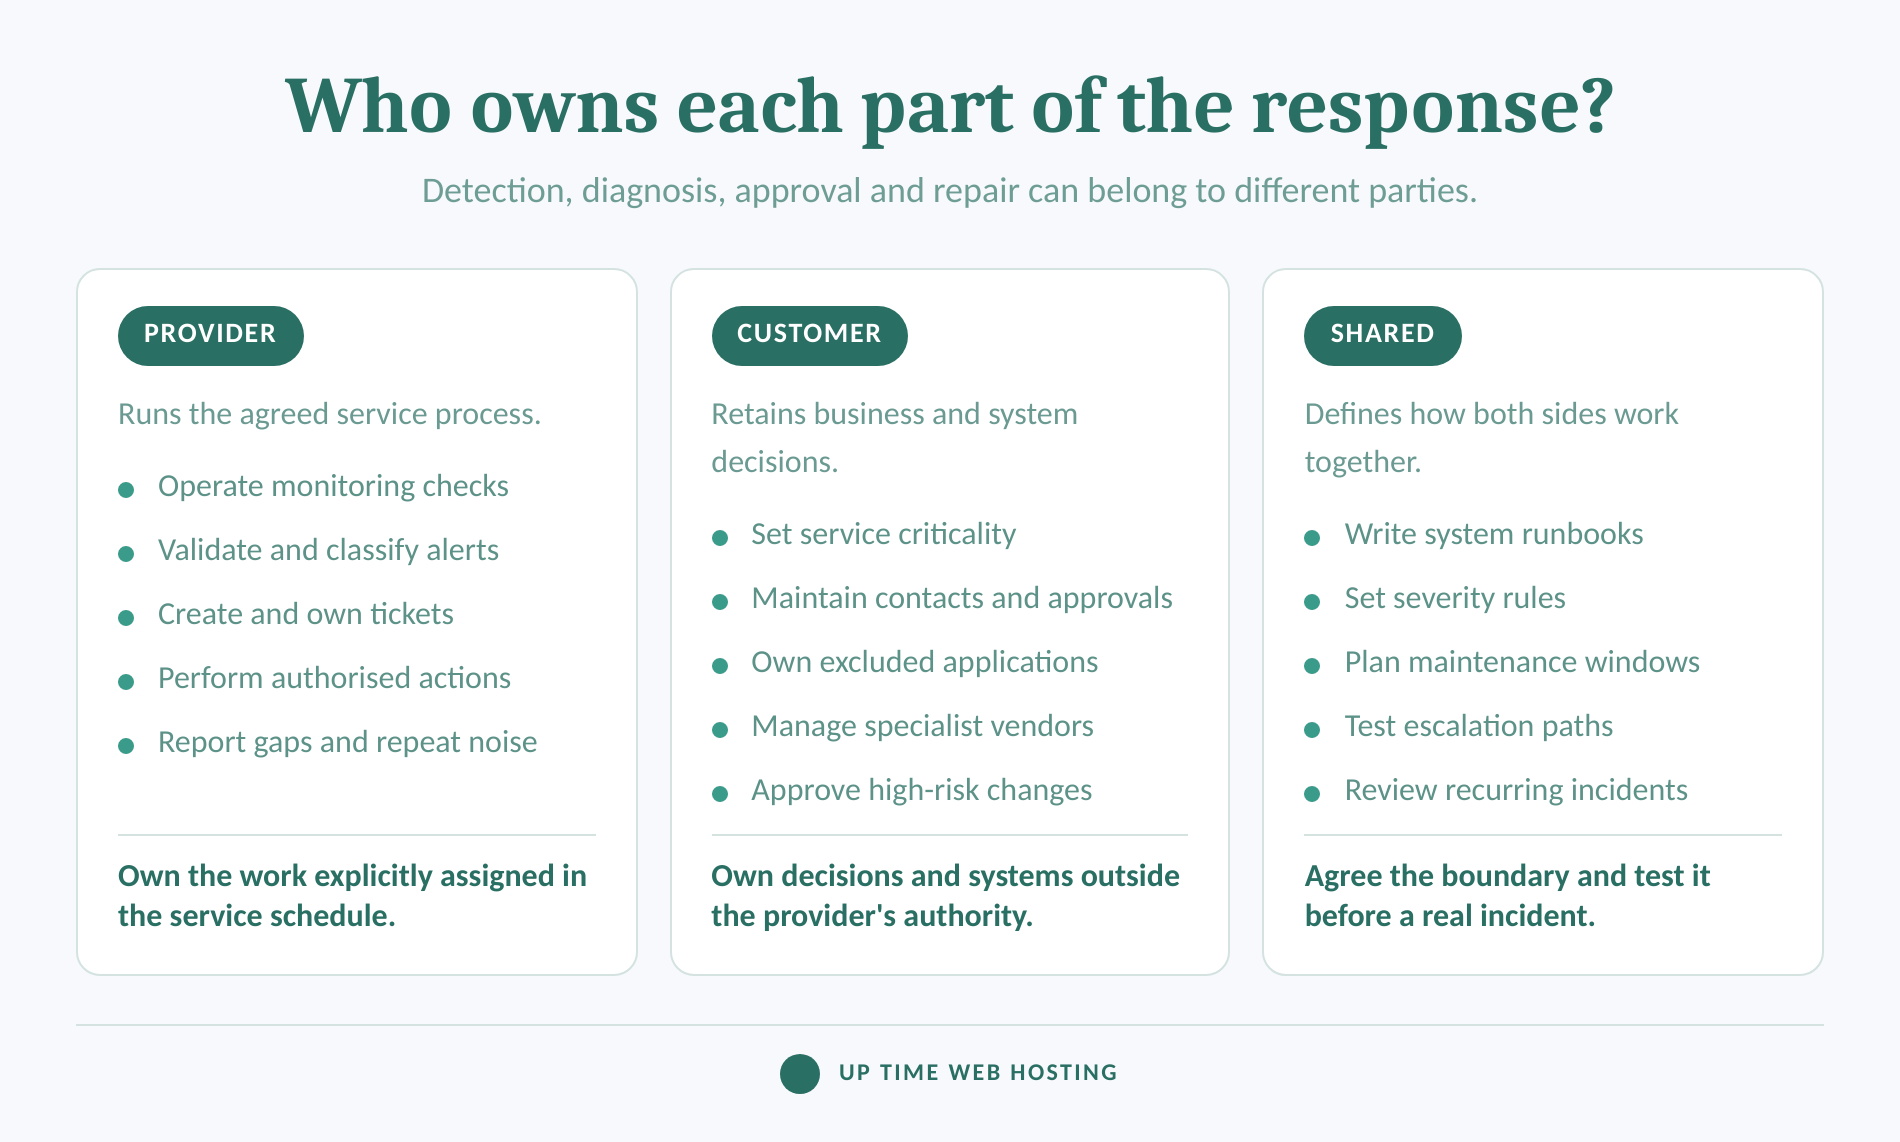
The provider should normally own operation of the agreed monitoring platform, collection checks, notification routes, first-pass validation, ticket creation and communication required by the service schedule. The provider should also maintain its alert rules and identify checks that are repeatedly noisy or failing to collect data.
The customer should normally own business priorities, application decisions, current contact details, access approvals and changes that carry material business risk. The customer may also remain responsible for application code, software licences, specialist vendors and systems outside the provider's access or expertise.
Some responsibilities must be shared. These include defining critical services, approving maintenance windows, writing runbooks, setting severity rules, testing escalation paths and reviewing repeat incidents.
Remediation authority can be divided into four practical levels:
- Notify only: The provider reports the condition but cannot access or change the server.
- Read-only investigation: The provider can inspect health, logs and configuration without making changes.
- Pre-approved runbook actions: The provider can perform named actions such as restarting one service or clearing a safe temporary directory.
- Case-by-case approval: The provider investigates, proposes a change and waits for an authorised customer contact.
The highest level is not automatically the best. Broad change authority can speed restoration, but it also requires suitable access controls, audit records, technical competence and clear limits. A narrow runbook may be safer for a critical database than a general permission to make whatever change appears necessary.
Operating-system scope also matters. A provider responsible for Windows Server management may be able to investigate services, event logs and system resources, while an application fault still belongs to the software owner or developer.
For major events, Google SRE's incident-response guidance separates incident command, operational work and communications. A small business may not need formal role titles, but it still needs one person coordinating the response, one clear technical owner and one channel for stakeholder updates.
Monitoring responsibility must be divided explicitly because detection, diagnosis, approval and repair are different jobs.
How should alerts be prioritised and escalated?
Alerts should be prioritised by user impact, time to failure, security significance and the action required. Severity labels are useful only when each label has a defined route, response target and escalation path.
A simple model is:
- Critical: A business service is unavailable, data or security may be at immediate risk, or a hard limit is about to stop the service. Page the on-call responder through more than one reliable channel.
- Urgent: Performance is materially degraded, redundancy has been lost or a resource is approaching failure. Create an urgent ticket and notify the assigned responder within the contracted period.
- Warning: A trend, failed background task or non-critical component needs attention but can wait for scheduled handling. Route it to a business-hours queue.
- Informational: The event is useful for reporting, audit or trend analysis but requires no immediate human action. Record it without paging anyone.
This reflects the alert, ticket and record distinction in Google's monitoring guidance. It also addresses a common operational failure: treating every event as urgent until staff learn to ignore all of them.
Threshold persistence can reduce short-lived noise. A CPU spike lasting seconds may be normal, while sustained saturation alongside slow requests may require intervention. Dependency correlation can also prevent one failed database from creating separate pages for every application that depends on it.
The escalation schedule should name:
- The primary responder for each severity and service.
- A backup responder if acknowledgement does not occur.
- The customer contact who can approve disruptive work.
- The application, carrier or hardware vendor to contact when the fault leaves the provider's scope.
- The manager or incident coordinator for prolonged or high-impact events.
- An alternative communication channel if normal email, identity or network services fail.
Response arrangements should also account for security events. NIST SP 800-61 Revision 3, published in April 2025 recommends integrating incident response into broader risk management and using response plans to guide communication with internal and external stakeholders.
Every alert needs a severity, a response route, an acknowledgement target and a named escalation path.
What should be agreed before monitoring starts?
The service schedule should list monitored assets, checks, thresholds, exclusions, response hours, communication routes, access and permitted actions. If any of these remain implied, the provider and customer may discover different expectations during the first serious outage.
What belongs in the service schedule?
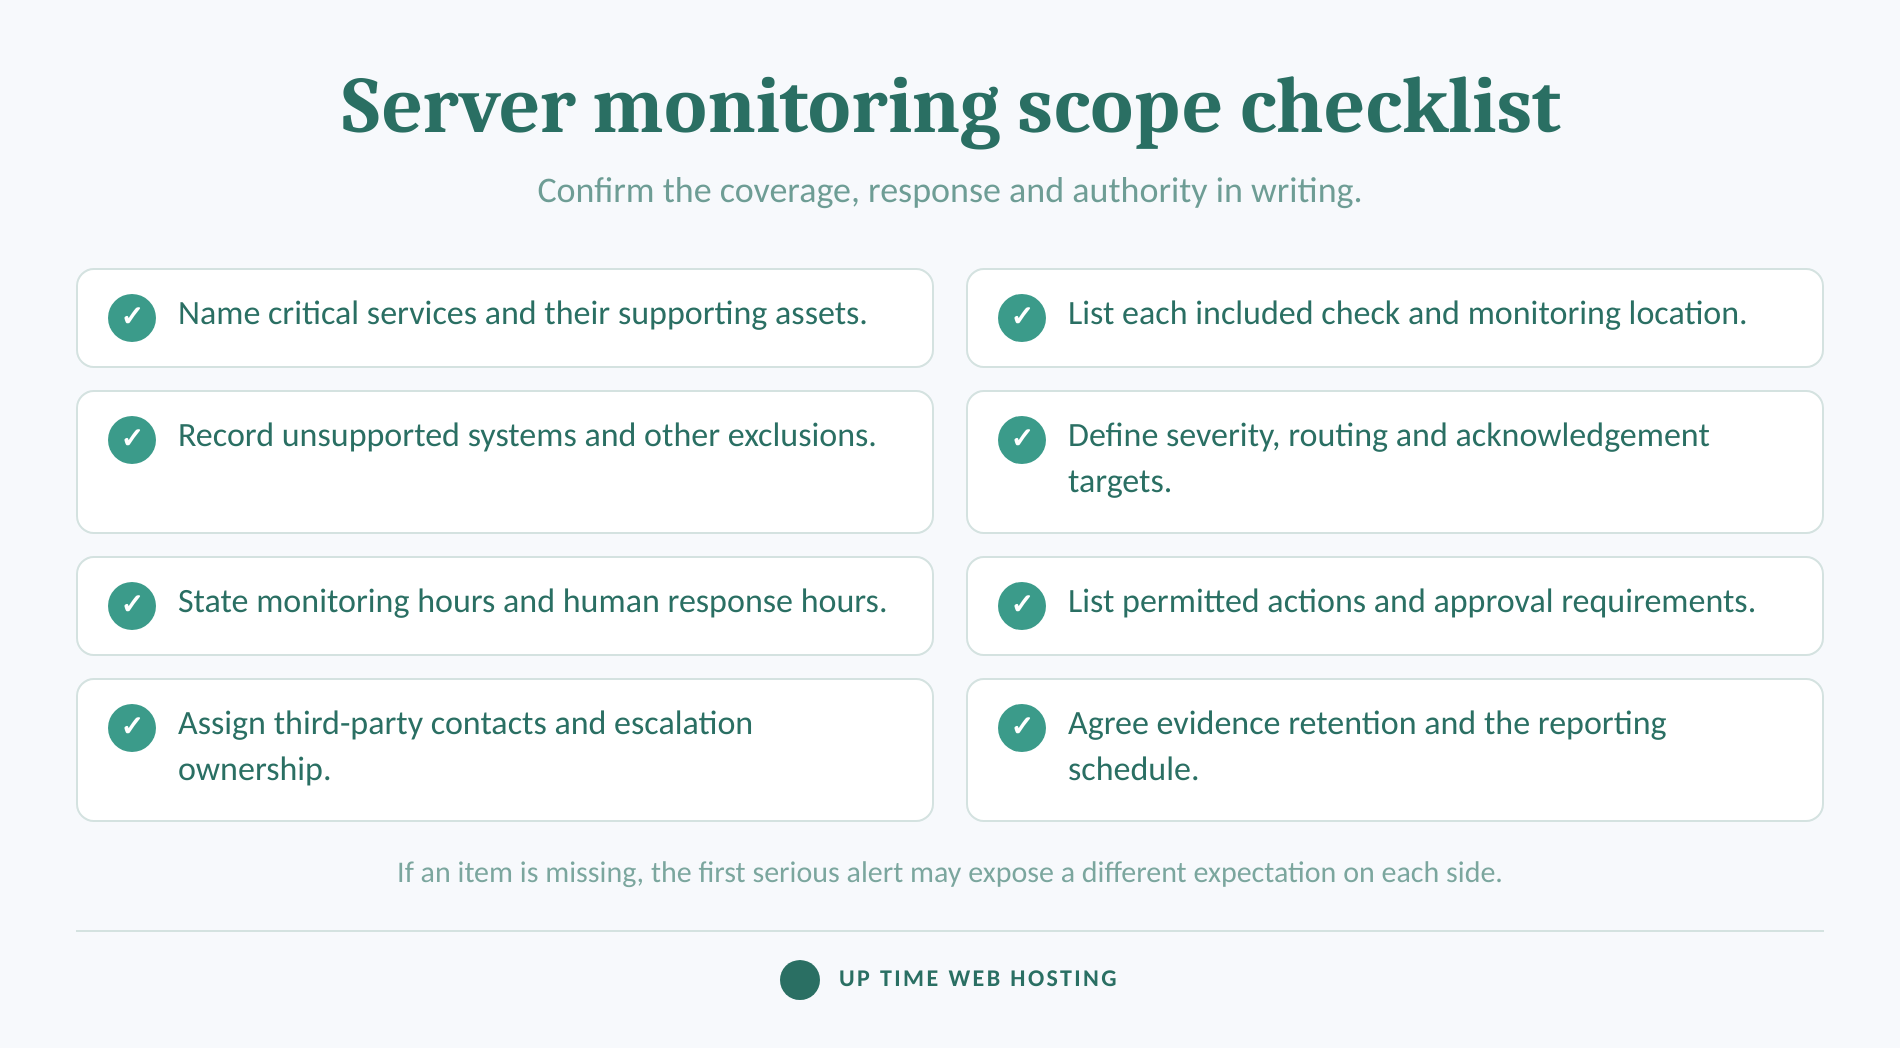
Use these questions during scoping:
- Which business services are critical? Name the website, database, file service or application that users depend on, not just the server hostname.
- Which assets and dependencies are included? Record servers, virtual machines, network devices, storage, certificates, backups and third-party services that the provider can actually observe.
- Which checks run, and from where? State whether checks are external, agent-based, log-based or collected through a management interface, along with their frequency and location.
- What is excluded? Identify unsupported applications, unmanaged devices, customer networks, development systems and third-party platforms outside the agreement.
- How are alerts classified and delivered? Define severities, suppression rules, ticket queues, phone or SMS routes, acknowledgement targets and backup contacts.
- What may the provider do without asking? List exact read-only access and pre-approved remediation steps. Include actions that always require customer approval.
- Who handles third parties? Decide who contacts software vendors, carriers, data-centre operators or developers and who remains responsible for follow-up.
- What evidence and reports are retained? State the incident record, alert history, log access, response measurements, retention period and review schedule.
Treat exclusions as seriously as inclusions. A server may depend on a customer-managed firewall, external identity service or application vendor that the monitoring provider cannot change. That boundary should appear in the escalation map rather than emerging during an incident.
Access arrangements should follow the minimum permissions needed for the agreed work. Shared generic administrator accounts make ownership harder to prove. Named accounts, protected credentials, access logs and an offboarding process give the customer a clearer record of who could inspect or change the system.
The service should also explain change control. A restart that is safe for one stateless web worker could interrupt a database transaction or scheduled processing job elsewhere. Runbooks must be specific to the system, not copied from a generic checklist.
Finally, test the plan. Trigger a harmless monitoring condition, confirm that the right person receives it, verify that the ticket contains useful context and check that the backup contact is reached when the first responder does not acknowledge it.
The service schedule should make continuous coverage, access, authority, exclusions and reporting unambiguous.
Register your new domain name at competitive market prices including free domain add-ons like privacy, DNS Hosting, Custom Nameservers and Forwarding.
Always the best price and no nasty renewal price hikes.
Register A Domain Name
How do you tell if the service is working?
A monitoring service is working when it provides dependable coverage, actionable alerts, timely ownership, useful investigation evidence and visible follow-up. A report that lists uptime percentages without showing incidents, actions and gaps is not enough to assess the service.
What should a useful service report show?

A useful report should show:
- Coverage: Which assets and checks reported successfully, along with monitoring gaps or stale agents.
- Service availability: User-visible availability and performance for the agreed business service, not only host uptime.
- Incidents by severity: When each incident began, how it was detected, who acknowledged it and when service was restored.
- Actions taken: Investigations, approved remediation, customer decisions, vendor escalations and verification steps.
- Alert quality: False positives, duplicate alerts, frequently ignored warnings and rules that need tuning.
- Capacity trends: Growth in storage, memory pressure, workload or other indicators that could require planned work.
- Repeat faults: Incidents sharing a cause, incomplete corrective actions and recurring manual fixes that should be automated or redesigned.
- Service performance: Missed acknowledgement targets, communication gaps and unresolved ownership questions.
The report should make it possible to select next actions. A capacity trend may justify planned expansion. Repeated service restarts may justify application investigation. A noisy rule may need a different threshold or dependency check.
Google's post-incident guidance recommends retaining details such as incident roles, timelines, severity, affected services, detection mechanisms and corrective actions. A small business report can use the same principles without adopting a large-enterprise process.
A useful monitoring report proves what was watched, what happened, what changed and what still needs attention.
How is a managed service different from monitoring software?
Monitoring software collects, stores, displays and routes technical signals. A managed service adds people, operating procedures, service hours, accountability and an agreed response to those signals.
Software can provide agents, dashboards, logs, charts, integrations and notification rules. Open-source or free monitoring software can reduce licence costs, but somebody still has to install it, secure it, maintain collectors, tune thresholds, test notifications, investigate alerts and provide after-hours coverage.
A service can use the customer's existing monitoring platform or operate a provider-selected platform. The important commercial questions are not the brand of dashboard or the number of available integrations. They are:
- Who maintains the checks when servers and applications change?
- Who reviews failed agents and missing data?
- Who decides which event is page-worthy and which can wait for business hours?
- Who acknowledges and investigates the alert?
- Who has access and permission to act?
- Who owns the incident until service is restored?
A poorly scoped service can still become another dashboard nobody watches. A well-run internal team may need software rather than an external service if it already has on-call coverage, system knowledge, access, runbooks and time to maintain the monitoring platform.
For small and midsize businesses without continuous infrastructure staff, managed server monitoring can fill the coverage and triage gap. It does not remove the need for customer decisions, application specialists or vendors when a fault sits outside the provider's authority.
Software produces signals; a managed service adds the people, process and accountability required to act on them.
Experience Microsoft 365 Business Standard for free for 30 days.
Up to 25 users with full access to email, OneDrive and Teams. Includes full versions of desktop apps of Outlook, Word, Excel, PowerPoint and more.
Try Microsoft 365
What else do businesses ask about server monitoring?
These questions reflect the phrases searchers commonly use when comparing monitoring options. The answers focus on choosing and operating a service without naming competing products.
What is the best tool for monitoring servers?
There is no single best tool for every server estate. Choose by operating systems, on-premises or cloud coverage, application visibility, alert routing, log retention, access controls, reporting and the skills available to maintain it. If nobody can tune alerts and respond after hours, compare managed service scope before comparing feature lists.
What are the three types of monitoring?
The phrase three types of monitoring is ambiguous. For a practical server scope, use availability monitoring, performance monitoring and security or event monitoring. Another useful technical split is black-box checks, white-box metrics and log-based monitoring. The provider should define the chosen model and list exactly which checks sit in each group.
What does monitoring service mean?
A monitoring service is an arrangement in which a provider operates monitoring checks for agreed systems and sends reports or alerts when defined conditions occur. The service may also include triage, ticketing, escalation or approved remediation, but those actions are not automatic unless the contract and runbooks assign them to the provider.
Which APM tool is best?
The best application performance monitoring choice depends on the application stack, transaction paths, deployment model, data volume, integrations and the people who will investigate results. For a small business, the deciding question is often operational: can the provider connect application alerts to server, network and log evidence, then route the incident to a named responder?
The best monitoring choice is the one that matches the estate and leaves no alert without an owner.
Is server monitoring as a service right for your business?
Server monitoring as a service is a strong fit when systems matter outside business hours but no internal person is consistently available to watch and respond. It is a poor fit when the provider's scope ends at noisy email alerts, critical systems are excluded or nobody has authority to act.
Before signing, ask the provider to demonstrate one realistic incident path. For example: an external website check fails, the server remains reachable, the web service is running and the database reports connection errors. The provider should be able to explain who receives the alert, what evidence is checked, which actions are permitted, when the customer is contacted and who owns the incident through recovery.
Also confirm what the service is not. Monitoring does not replace tested backups, recovery planning, application support, security controls, patch management or capacity work unless those functions are explicitly included.
For Australian businesses seeking security-led managed support, ask UpTime Networks about Security and Protection and take the scope checklist above to the discussion. Request a written matrix covering monitored assets, alert priorities, acknowledgement targets, access, permitted fixes, third-party escalation and reporting.
Take the scope checklist to the provider and do not buy until every critical alert has an agreed owner and next action.