In short
IIS server monitoring should combine an external availability check with application-pool state, HTTP request queues, request rate, response time, 5xx errors, worker-process CPU and memory, and disk capacity. Alert on sustained change from a known baseline, then use IIS, HTTPERR and Windows event logs to identify the failing layer.
Key takeaways
- An external check should test a representative dynamic URL because a running IIS service does not prove that the public application works.
- A request queue becomes urgent when it keeps growing, rejected requests increase, or response times rise at the same time.
- IIS W3C logs should include status, substatus, Win32 status and time taken so an alert can be tied to a URL and failure type.
- Resource alerts should combine worker-process pressure with queue growth, errors or latency instead of paging someone for CPU alone.
- Every IIS alert needs an owner, a severity and a first diagnostic action before it is placed into production.
Table of contents
- Which IIS signals should you monitor first?
- How do you tell an IIS problem from an application problem?
- Which IIS logs explain slow or failed requests?
- What should trigger an IIS alert?
- How do you set up IIS monitoring without drowning in alerts?
- What else do people ask about IIS monitoring?
- What should you do next?
IIS can look healthy while an ASP.NET website is slow, returning errors or waiting on a database. A useful monitoring plan therefore checks the public request, IIS and HTTP.sys, the application pool, the w3wp.exe worker process, Windows resources and application dependencies.
This guide focuses on what to measure and how to interpret it. The wider operating model, including who watches the alerts and responds after hours, is covered in server monitoring as a service.
Which IIS signals should you monitor first?
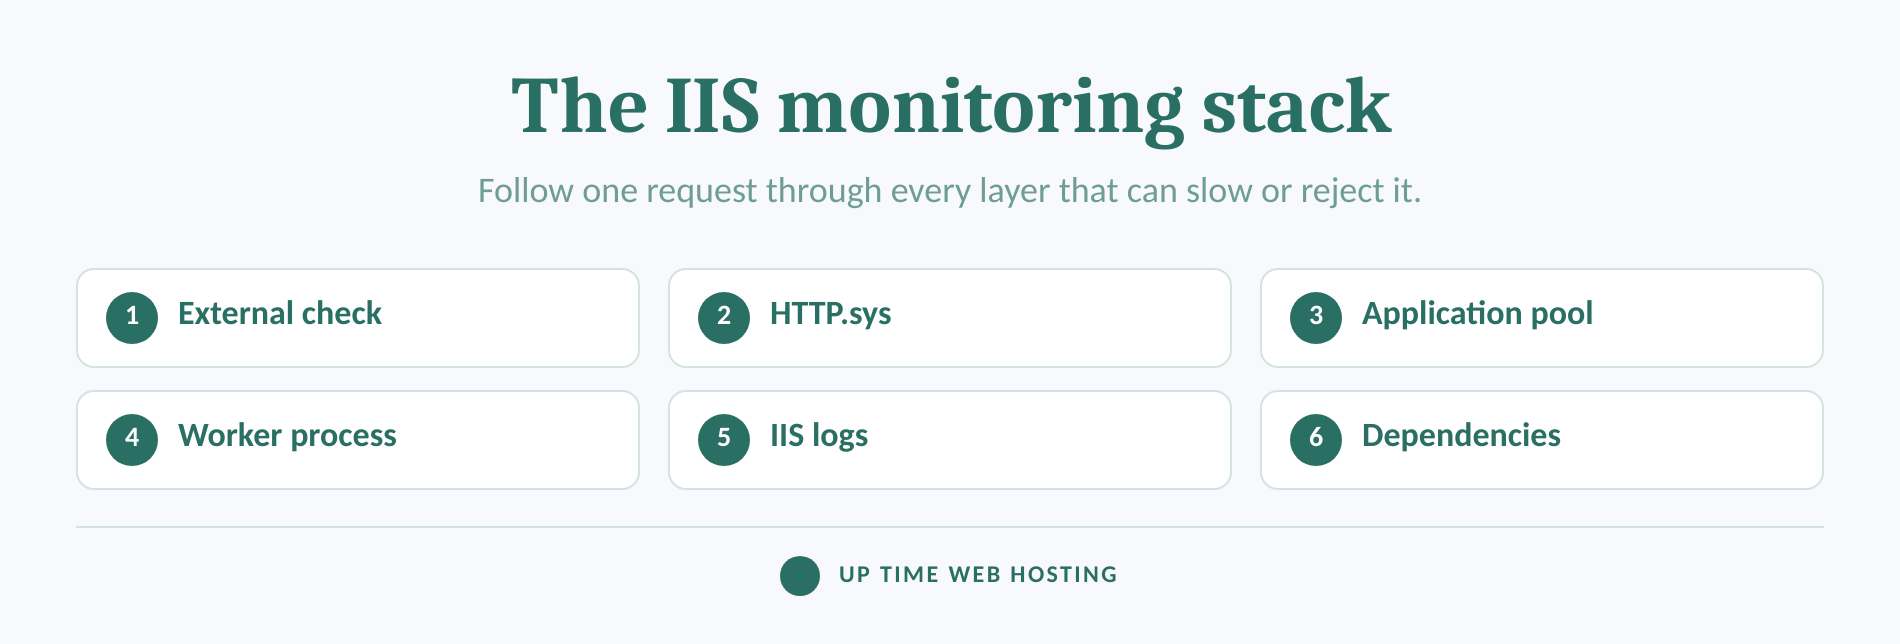
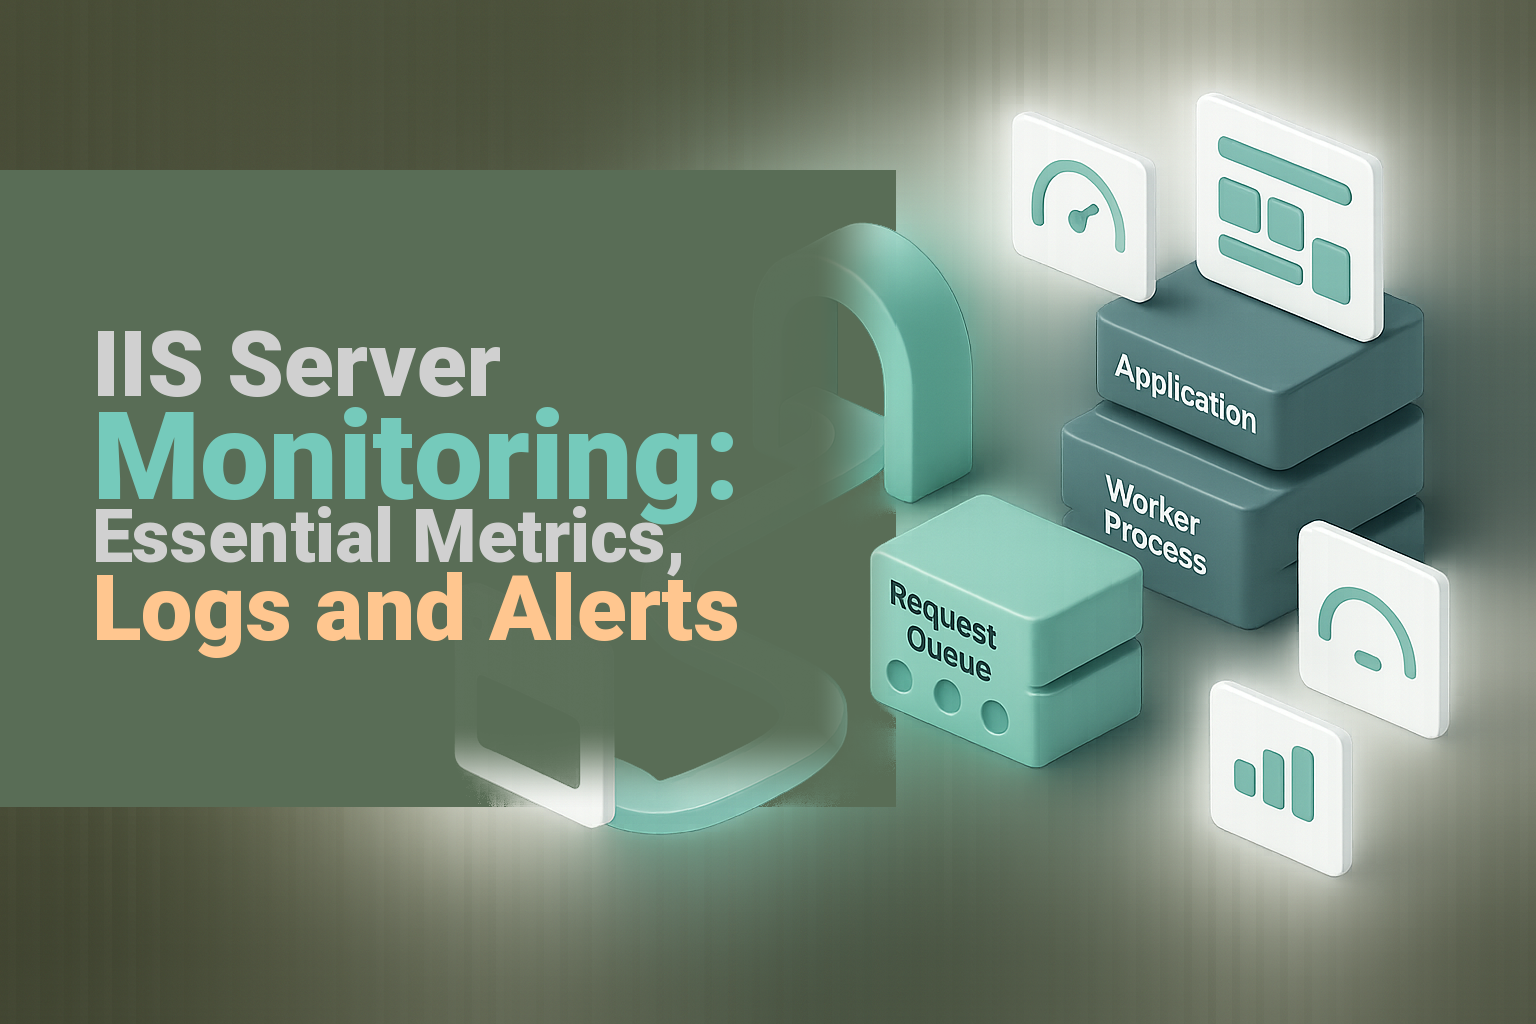
Monitor the complete request path, not a single IIS counter. The minimum useful view combines outside-in availability, request handling, application-pool health, response results and the resources consumed by the worker process.
The monitoring stack should follow a request from the public network to the application and its dependencies.
Microsoft's 2026 Windows Server performance guidance confirms that Performance Monitor is built into full Windows releases and can record counters with Data Collector Sets. The IIS Administration API monitoring reference exposes related measurements for websites and application pools, including active requests, requests per second, connections, CPU usage and private memory.
Put these six groups on the dashboard:
- External availability and transaction time. Check a public, read-only URL from outside the server. Test DNS, TLS, the expected status code and a small content match. A simple health URL is useful, but a representative dynamic page catches application and dependency failures that a static file can miss. The outside-in method is also central to remote server monitoring.
- Website and application-pool state. Alert if a required site or pool is stopped. Record planned recycles and configuration changes so a normal maintenance event is not confused with a crash or rapid-fail condition.
- Request load and connections. Track total requests per second, active requests and current connections. A traffic rise is not automatically a fault, but it provides essential context for changes in queue length, latency and resource use.
- Request queues and rejections. The IIS counter set includes
HTTP Service Request Queues(*)CurrentQueueSizeand rejected-request measurements, as documented in Microsoft's IIS counter guide. Compare the current queue with the pool's configured capacity rather than a generic number. Microsoft's ApplicationPool class documentation explains that HTTP.sys rejects further requests with a 503 response after the configured queue limit is exceeded.
- Response time and HTTP results. Track the 95th-percentile response time for important URLs, the share of 5xx responses and changes in common 4xx responses. Keep raw counts as well as percentages so a single error during a quiet period does not create a misleading ratio.
- Worker-process and server resources. Monitor CPU, private bytes, working set, handles and threads for
w3wp.exe, then add total server CPU, available memory, paging, disk latency, free disk capacity and network throughput. Resource use becomes actionable when it coincides with queues, slow requests or errors.
If several websites share one application pool, pool-level figures cannot reliably identify which site created the load. Microsoft also warns that site monitoring data inherited from a shared pool may be inaccurate at site level, so record the pool relationship before diagnosing an individual website.
The strongest IIS dashboard follows the request from the public network to the application's dependencies.

Performance you can feel, backed by clients who depend on it. Read how our support and uptime create long‑term customer success.Power Your Business with Better Hosting
How do you tell an IIS problem from an application problem?
Use several signals from the same time window to identify the likely fault layer. One counter can describe a symptom, but a combination of availability, queue, status, process and dependency data provides a useful diagnosis path.
| Signal pattern | More likely layer | First check |
|---|---|---|
| External check fails and the application pool is stopped | IIS application pool or Windows Process Activation Service | Confirm pool state, recent failure events and service status. |
Response time rises, the queue grows and w3wp.exe CPU is high | Worker-process or application saturation | Find the slowest URLs and compare the change with request volume. |
| Response time and queue length rise while worker CPU remains low | Blocked application work or a slow dependency | Check application traces, database calls and outbound API timings. |
| 500 responses align with ASP.NET errors in the Application event log | Application code or runtime | Read the exception and compare it with the latest deployment. |
| 503 responses align with rejected requests or a full queue | HTTP.sys or application-pool capacity | Check pool state, queue configuration and request concurrency. |
| Every IIS site slows while disk or memory pressure rises | Windows host or another process | Compare system counters and identify the process consuming the resource. |
Treat this table as a triage guide, not proof. A worker process can consume CPU because of inefficient application code, a traffic spike or security scanning, while low CPU can accompany requests blocked on a database, file share or remote API.
Add deployment, configuration and recycle timestamps to the same incident view. A clear change marker often saves more time than another dashboard because it shows what happened immediately before the first error or latency increase.
No single IIS metric identifies the root cause, so diagnose with correlated signals from the same time window.
Which IIS logs explain slow or failed requests?
Start with W3C IIS logs because they connect each request to a URL, result and duration. Add HTTPERR logs, the Windows Application and System logs, and selective Failed Request Tracing when the ordinary request record does not explain the failure.
Select enough W3C fields to identify the URL, result, Windows status and request duration.
Microsoft's IIS logging configuration reference identifies the fields available in IIS Manager. A practical troubleshooting set includes:
dateandtimeto align requests with counters, deployments and eventscs-hostto identify the requested host namecs-methodandcs-uri-stemto identify the action and URLcs-uri-queryonly when the application needs it and the retention policy permits itsc-statusandsc-substatusto classify the HTTP resultsc-win32-statusto expose the underlying Windows resulttime-takento record request duration in millisecondssc-bytesandcs-bytesto add response and request-size context- the user agent and client IP where operational and privacy policies allow them
Do not interpret time-taken as application execution time alone. Microsoft's 2024 time-taken field documentation explains that IIS 7 and later can include network time while HTTP.sys waits for the final response acknowledgement. A large response sent to a slow client can therefore look like a slow server request.
Microsoft's 2025 IIS error-troubleshooting guidance recommends checking both IIS and HTTPERR logs. Requests rejected by HTTP.sys may never reach IIS, so inspect C:WindowsSystem32LogFilesHTTPERR when an external check sees an error that is absent from the normal site log.
For 500 responses from ASP.NET or ASP.NET Core, align the request with the Windows Application log and the application's own structured logs. Keep detailed error pages restricted to safe diagnostic environments because exposing exception details to remote users can reveal sensitive information.
Use Microsoft's 2026 Failed Request Tracing guidance when a particular status code or slow request needs module-level detail. Configure a narrow rule and a file limit instead of tracing every successful request indefinitely.
Finally, enable the required recycle-reason events. Microsoft's application-pool recycling documentation shows that IIS can log causes such as scheduled recycling, memory conditions, configuration changes and on-demand recycling.
IIS logs tell you which request failed, while HTTPERR, event logs and selective tracing explain where it failed.
Host your website with our 5-star rated, cPanel website hosting plans.
Super fast servers, with security included and hosted in your choice of Australian Data Center.
View cPanel Plans
What should trigger an IIS alert?
Trigger alerts on user impact or on a sustained condition that is likely to create user impact. The most useful rules combine a symptom with duration, workload context and a first-response instruction.
The conditions below are starter rule shapes, not Microsoft defaults. Tune them against at least one normal business cycle, including known peak periods, maintenance windows and scheduled jobs.
| Signal | Alert condition | Priority | First response |
|---|---|---|---|
| External transaction | The representative URL repeatedly fails and a second check confirms the result | Critical | Confirm scope, status code, DNS and TLS before changing IIS. |
| Application-pool state | A required pool is not started outside an approved change window | Critical | Check pool events, rapid-fail protection and the latest deployment. |
| Rejected requests | The rejected-request counter begins increasing | Critical | Check queue capacity, pool health and whether workers are accepting requests. |
| Current queue size | The queue keeps rising with latency or 503 responses | High | Identify the slowest URLs and compare worker CPU with dependency latency. |
| 5xx responses | The error rate breaks its normal range with enough requests to be meaningful | High | Group errors by URL, status, substatus and deployment time. |
| Response time | The 95th percentile exceeds the agreed service objective or materially departs from baseline | High | Separate slow URLs and compare application, database and network timing. |
| Worker resources | Process pressure is sustained and accompanied by queues, errors or slow requests | High | Identify the affected pool and inspect application activity before recycling. |
| Disk capacity | Current growth is projected to exhaust safe headroom before the next maintenance opportunity | Warning | Check IIS logs, traces, dumps, deployments and retention settings. |
| Unexpected recycling | A pool recycles repeatedly or outside its planned schedule | High | Read the logged recycle reason and inspect memory, health and configuration events. |
Avoid alerts based only on average response time. A small set of very slow requests can be hidden by a large number of fast static files, so separate important dynamic URLs and use a percentile or service objective that reflects the user experience.
Do not automatically recycle every busy worker process. Recycling can temporarily clear memory or blocked work, but it can also remove evidence, interrupt in-flight requests and hide a recurring application fault. Capture the relevant logs and counters first unless the runbook identifies an immediate availability risk.
An IIS alert is actionable only when its condition, severity, owner and first diagnostic step are defined together.
How do you set up IIS monitoring without drowning in alerts?
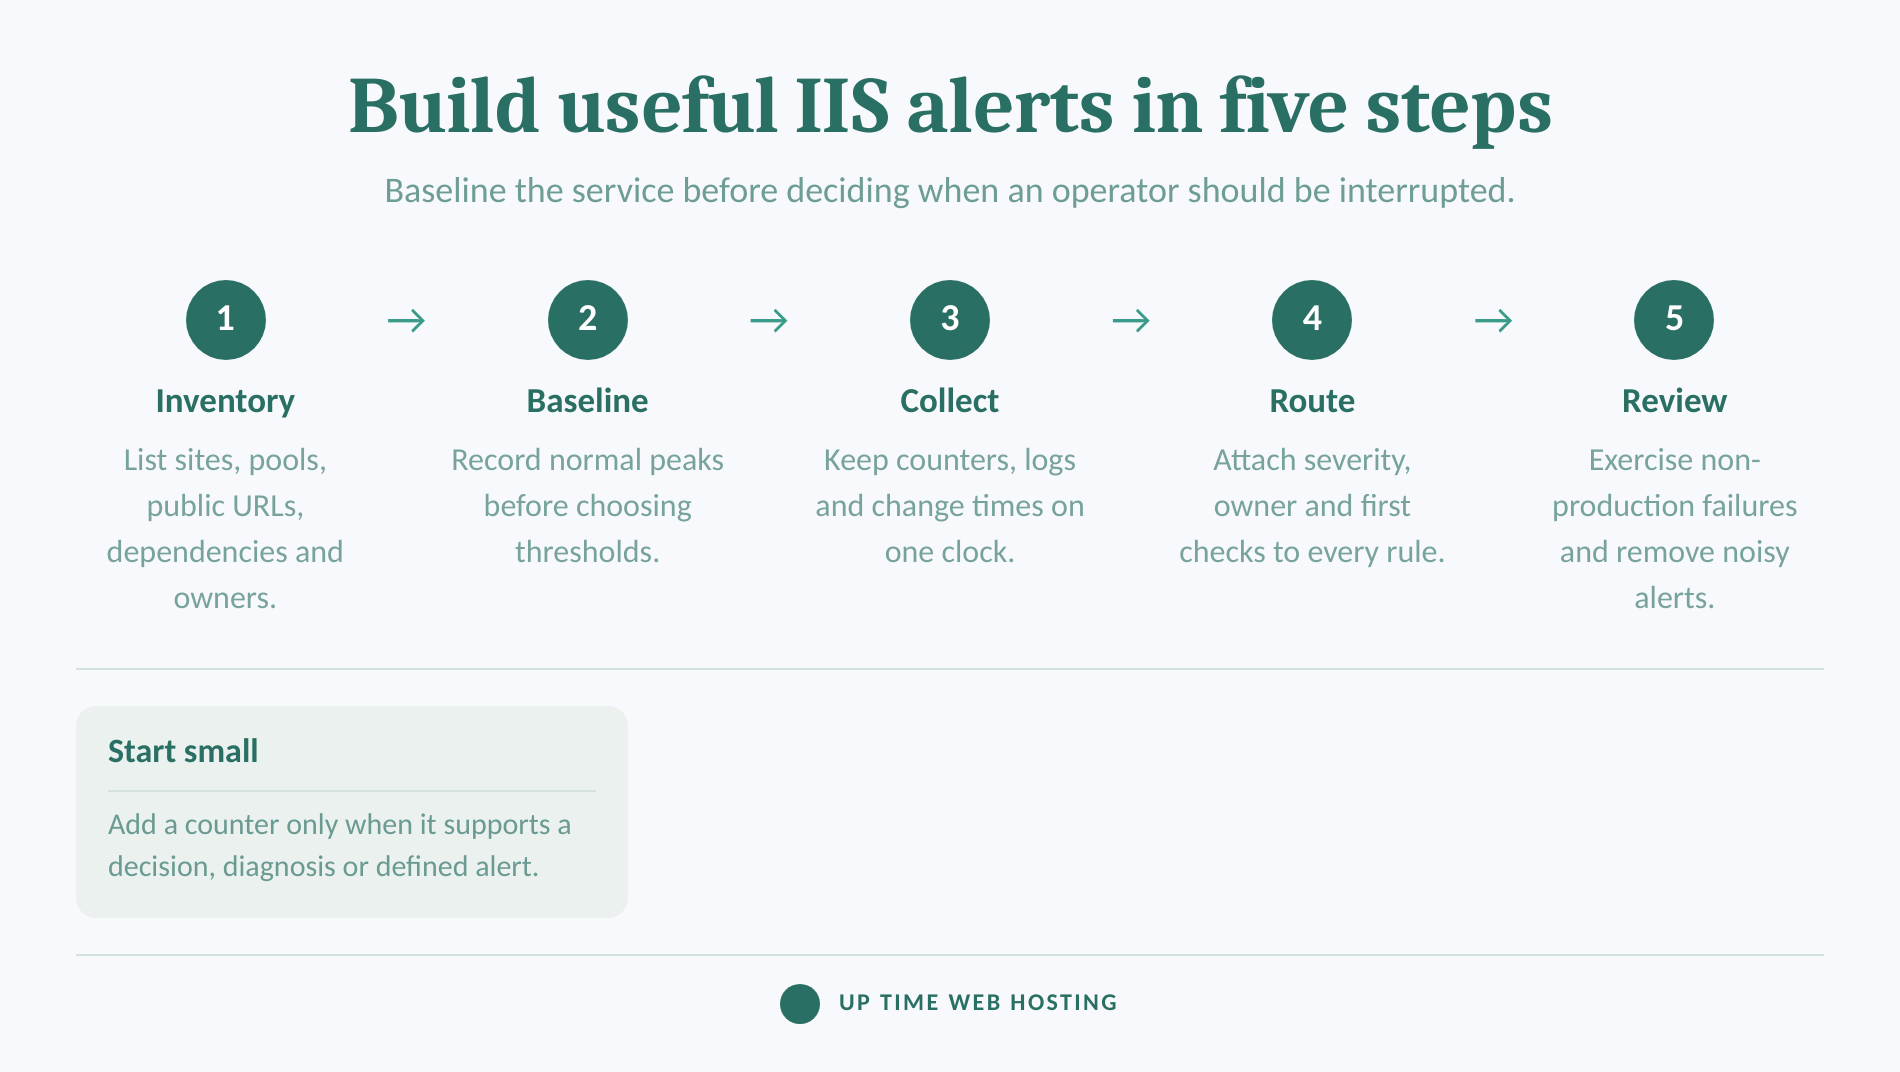
Build the monitoring configuration in five passes: inventory, baseline, collection, response and review. This order prevents a long counter list from becoming a noisy alert system with no operational value.
- Inventory the request path. Record every public host name, representative URL, IIS site, application pool, worker process, database, file store and external API. Name a business owner and technical owner for each important service. For mixed server estates, keep the response model consistent but use platform-specific measurements such as those in linux server monitoring.
- Capture a normal baseline. Use a Performance Monitor Data Collector Set, IIS logs and an external transaction to record normal traffic peaks, response time, queue behaviour, worker resources and error patterns. Do this before selecting thresholds. Otherwise, an ordinary Monday morning peak can look like an incident.
- Put the records on one timeline. Use a consistent time zone, retain enough history for comparison and attach the site, pool and server identity to each record. Add deployment, Windows update, configuration and recycle markers so changes can be compared with symptoms.
- Write the runbook with the alert. Define the severity, owner, first three checks, escalation point and safe recovery action. Distinguish a website outage from a warning that needs investigation during business hours. That ownership layer is separate from counter selection and is covered under it monitoring.
- Test and review the rules. Exercise failures on a non-production site or during an approved maintenance window. Confirm that the external check, pool-state alert, log collection and escalation route work. Review false positives, missed incidents and unused dashboards after releases or material traffic changes.
Begin with a small set of signals that can change an operator's decision. Add another counter only when it answers a specific diagnostic question or supports a defined alert.
Monitoring becomes operational only after the measurements, history, runbook and responsible person are connected.
What else do people ask about IIS monitoring?
The common questions cover IIS relevance, tool selection, built-in Windows monitoring and log analysis. The answers below separate the monitoring method from any single commercial product.
Does anyone still use IIS?
As of September 2026, yes. Microsoft's Windows Server 2025 edition comparison lists Web Server (IIS) as an available role in Standard, Datacenter and Datacenter: Azure Edition. Organisations still use IIS for ASP.NET workloads and Windows-based hosting, although the right platform depends on application requirements, support skills and operating model.
What is the best monitoring tool for servers?
There is no single best monitoring tool for every server. Choose a tool that can collect Windows and IIS counters, test a real URL from outside the server, centralise logs, suppress duplicate alerts and route incidents to an owner. Use Windows Performance Monitor for baselining and diagnosis, not as the whole response system.
Does Windows have a network monitoring tool?
Windows Server includes Performance Monitor, which can collect local or remote counters for network interfaces, connections, CPU, memory, disks and processes. It is useful for diagnosis and baselining. IIS monitoring still needs an external website check because an internal counter cannot prove that DNS, TLS and the public request path work.
What tool can I use to analyze IIS logs?
For one-off analysis, Microsoft's 2025 Log Parser guidance shows how W3C IIS logs can be queried to group slow URLs, status codes and error periods. For ongoing operations, send selected fields to a central log store with saved queries, access controls, retention and alerting.
Built-in Windows tools provide useful evidence, but effective IIS monitoring also needs external checks and a clear response process.
Register your new domain name at competitive market prices including free domain add-ons like privacy, DNS Hosting, Custom Nameservers and Forwarding.
Always the best price and no nasty renewal price hikes.
Register A Domain Name
What should you do next?
Start with one representative URL, its application pool and one normal business cycle of counters and logs. Then create only the alerts that identify user impact, name an owner and point to a specific first check.
If recurring queues, 5xx responses or worker-process pressure cannot be resolved in application code, review Up Time's Australian website hosting for ASP.NET applications. Bring the baseline, request logs and incident timeline to the discussion so capacity and configuration decisions are based on evidence.
Start with the request path, then add alerts only when each alert has an owner and a first diagnostic step.