
In short
Linux server monitoring should start with the user-facing service, then track critical processes, CPU and memory pressure, storage, network health, logs, backups and the monitoring path itself. Page immediately for confirmed customer impact, active security risk or imminent data loss; route slower capacity risks to scheduled investigation.
Key takeaways
- External checks should test the function users depend on, while internal metrics provide evidence for diagnosis.
- Linux load average includes runnable tasks and tasks waiting for disk I/O, so it is not the same as CPU percentage.
- Available memory, swap activity and memory pressure are more useful together than free RAM alone.
- Storage monitoring should cover free blocks, inodes, latency, queueing, device errors and growth.
- An immediate page needs a named owner and an action that cannot safely wait until business hours.
Table of contents
- What should you monitor first on a Linux server?
- Which Linux metrics warn that the server is running out of capacity?
- Which service and log checks catch failures that resource graphs miss?
- Which alerts should wake someone up immediately?
- How should thresholds be set without creating alert fatigue?
- What are the best Linux server monitoring commands for a quick check?
- What else do businesses ask about Linux server monitoring?
- What should you do next?
What should you monitor first on a Linux server?
Monitor the business service first, then collect the internal signals needed to explain why that service is slow or unavailable. A server with comfortable resource graphs is not healthy if customers cannot complete the request, login or transaction it exists to support.
Google's Site Reliability Engineering guidance distinguishes between external, user-facing checks and internal system telemetry. The external check detects the symptom. Internal metrics, service state and logs help the responder locate the cause.
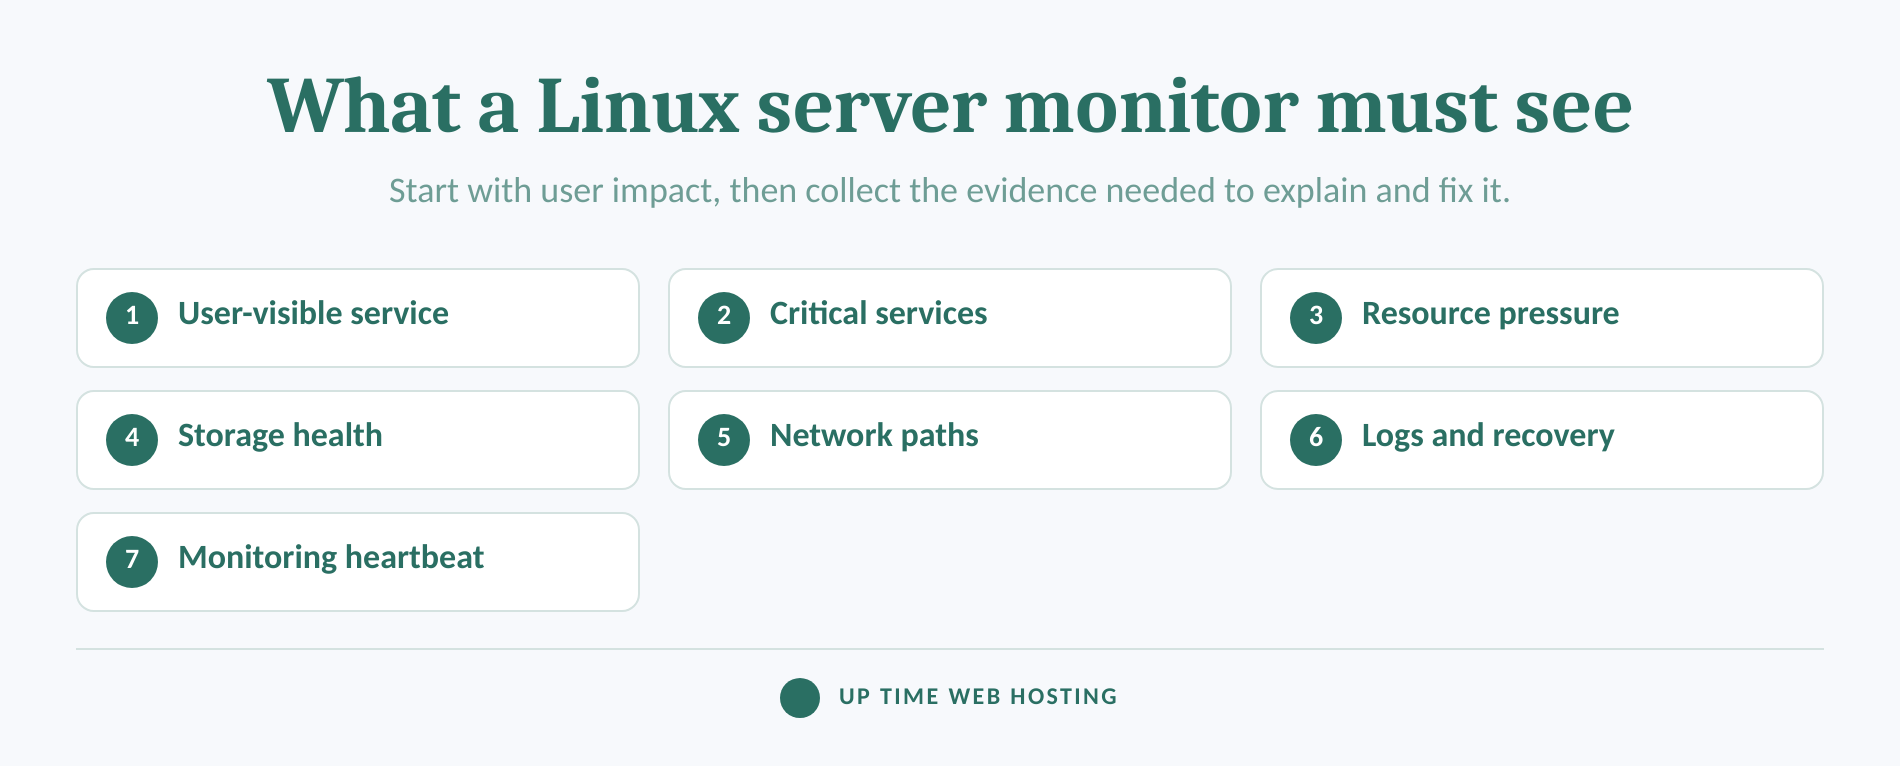
Use this order when defining coverage:
- User-visible function: Test DNS resolution, connection establishment, TLS, response status, response time and a representative application action where practical.
- Critical services: Check the web service, database, queue, scheduler and any application process that must be running.
- Resource pressure: Collect CPU scheduling, memory, storage and network signals as time series, not occasional snapshots.
- Dependencies: Test required databases, storage mounts, name resolution, upstream APIs and network paths.
- Protection and recovery: Check backup completion, certificate expiry, security events and restore readiness.
- The monitoring path: Alert on a missing agent, stale data, failed collector or broken notification route.
A website also needs checks above the server layer. Broader website health checks can detect certificate, application and content failures that a host-level check may miss.
A useful Linux monitoring scope starts with what customers experience and works inward towards the likely cause.

Performance you can feel, backed by clients who depend on it. Read how our support and uptime create long‑term customer success.Power Your Business with Better Hosting
Which Linux metrics warn that the server is running out of capacity?
Watch pressure, queues, latency and error signals alongside raw utilisation. Capacity problems develop when work cannot make progress, not simply when a percentage looks high for a moment.
| Area | What to watch | Developing failure signal | Quick diagnostic commands |
|---|---|---|---|
| CPU and scheduler | CPU modes, runnable queue, load per logical CPU, CPU pressure | Sustained queueing, rising pressure or reduced service throughput | uptime, top, vmstat 1, cat /proc/pressure/cpu |
| Memory | MemAvailable, swap input and output, memory pressure, OOM events | Available memory keeps falling while reclaim, swap or stalled work increases | free -h, vmstat 1, cat /proc/pressure/memory, journalctl -k |
| Storage | Free blocks, free inodes, growth, latency, queue depth and device errors | Reserve is shrinking, requests wait longer or the filesystem becomes read-only | df -h, df -i, iostat -xz 1, dmesg |
| Network | Reachability, latency, interface errors and drops, socket queues | Error or drop rates rise, dependencies time out or sockets accumulate | cat /proc/net/dev, ss -s, external probes |
| Application | Request latency, error rate, worker availability and queue depth | Users see slow or failed requests despite an online host | Application health endpoint and logs |
Linux load average is not CPU percentage. The Linux man-pages 6.18 definition of load average, dated February 2026, says it counts jobs that are runnable or waiting for disk I/O across 1, 5 and 15-minute averages, so a rising load can point to processor contention, blocked storage work or both.
For memory, use MemAvailable rather than treating low MemFree as an incident by itself. The Linux kernel's proc documentation defines MemAvailable as an estimate of memory that can be used for new applications without swapping, accounting for reclaimable cache and system watermarks.
As of September 2026, the Linux kernel PSI documentation exposes CPU, memory and I/O stall information through /proc/pressure/. Pressure Stall Information helps show whether tasks are being delayed by resource contention, which is closer to the operational problem than utilisation alone.
Do not diagnose storage from iowait alone. The kernel documentation warns that the /proc/stat iowait field has interpretation and accounting limitations. Compare it with device latency, queue depth, blocked processes, errors and I/O pressure.
Disk capacity also has two limits: blocks and inodes. The GNU Coreutils df manual documents block usage, while df --inodes reports inode consumption. A filesystem can reject new files even when byte capacity remains if its inodes are exhausted.
The iostat manual also cautions that utilisation close to 100 per cent does not reveal the limits of devices that serve requests in parallel, including modern SSD and RAID storage. Latency and queue behaviour still matter.
Network throughput answers a different question from server health. Use traffic monitoring tools when the goal is to understand visitor or application demand, but retain interface errors, drops, latency and dependency checks in the infrastructure scope.
Capacity monitoring should reveal work waiting for resources, not merely resources reporting a high percentage.
Which service and log checks catch failures that resource graphs miss?
Check service state, restart behaviour, listening sockets, scheduled jobs and logs for each critical workload. A process can stop, loop or lose a dependency while CPU, memory and disk graphs remain within their usual range.
The systemctl manual documents is-active, is-failed and failed unit states. Monitoring should also record restart counts because automatic recovery can hide a recurring crash from an availability graph.
Useful service checks include:
- The expected unit is active and has not entered a restart loop.
- The expected port is listening on the correct interface.
- A local health request returns valid application output, not merely an open socket.
- Scheduled jobs and timers completed at the expected time.
- Required mounts, databases, queues and upstream services are reachable.
- The server has not rebooted unexpectedly.
Use the journalctl manual to build focused queries by service, boot and priority. The ss manual covers listening sockets, connection states, queues and socket statistics. The dmesg manual documents filtering kernel messages by warning and error levels.
Route repeated service crashes, OOM kills, filesystem errors, device resets, authentication failures and unauthorised privilege or configuration changes to the owner able to investigate them. Security-significant events should not disappear inside a general performance notification channel.
Monitor backup job completion, backup age and the availability of the destination, but do not treat a successful job result as proof of recoverability. The Australian Cyber Security Centre's system-management guidance says restoration of data, applications and settings should be tested as part of disaster recovery exercises.
A wider downtime prevention guide can help connect these server checks with maintenance, recovery and website availability work.
Resource graphs describe the host; service checks and logs reveal whether the required workload is actually functioning.
Host your website with our 5-star rated, cPanel website hosting plans.
Super fast servers, with security included and hosted in your choice of Australian Data Center.
View cPanel Plans
Which alerts should wake someone up immediately?
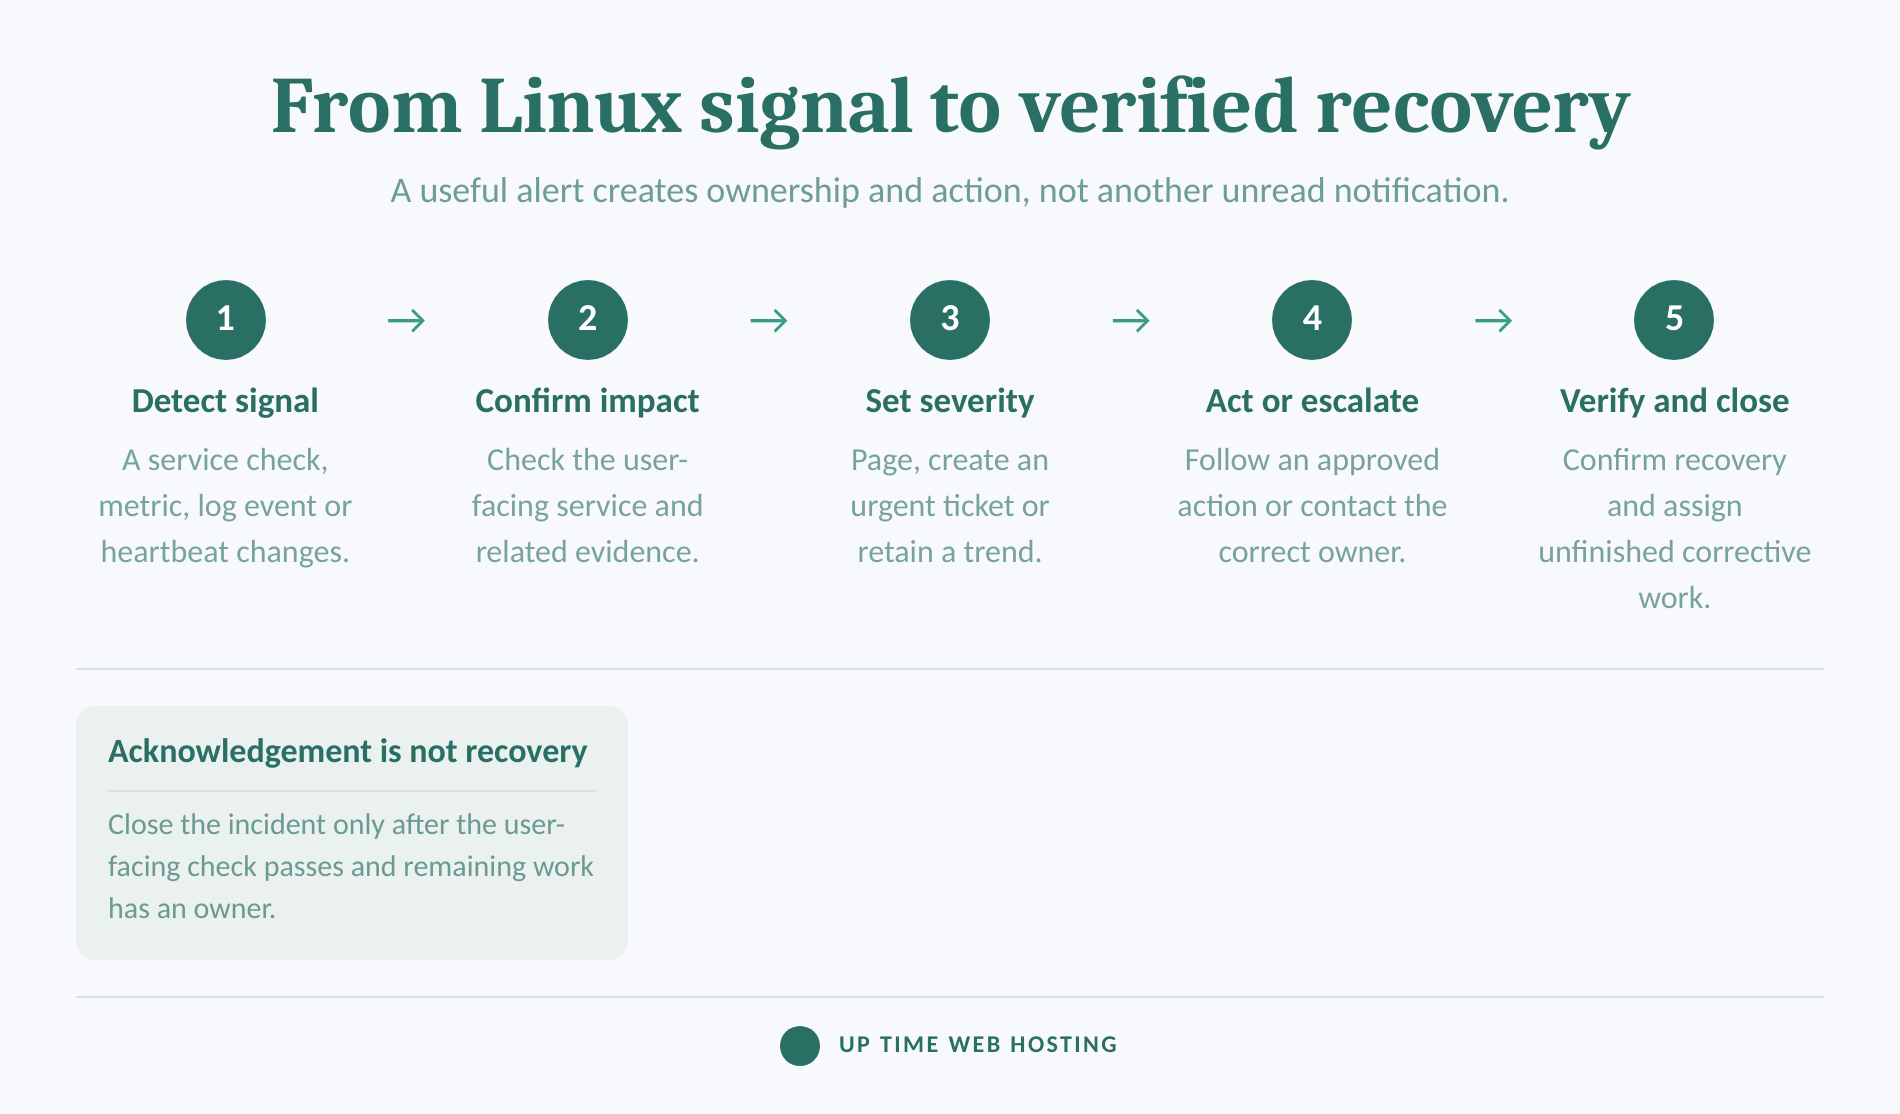
Page a person only when immediate action can reduce customer impact, security exposure or the risk of data loss. Conditions that need investigation but can safely wait should create an owned ticket instead of an after-hours interruption.
The broader response model is covered in our guide to server monitoring as a service. For an individual Linux server, divide conditions into three practical routes.
Page now:
- A confirmed customer-facing service or critical transaction is unavailable.
- A critical service cannot recover through its approved runbook.
- A filesystem is read-only, data integrity is at risk or storage exhaustion is imminent.
- An active security event requires containment or credential action.
- The server and an independent external check both indicate loss of service.
Create an urgent owned ticket:
- Resource pressure is persistent but customer impact has not been confirmed.
- Disk or inode growth is consuming the remaining operational reserve.
- A backup failed, became stale or could not reach its destination.
- A critical process is recovering automatically but repeatedly restarting.
- Monitoring data is stale, an agent is missing or a notification test failed.
Record and review as a trend:
- A short spike resolved without service impact.
- A single low-risk event needs correlation with later activity.
- Capacity is growing but sufficient planning time remains.
Acknowledgement means someone owns the incident. It does not mean the service has recovered. Close the alert only after the user-facing check passes and any remaining corrective work has a named owner.
An immediate page is justified only when a named responder has a useful action to take before the next business-hours review.
How should thresholds be set without creating alert fatigue?
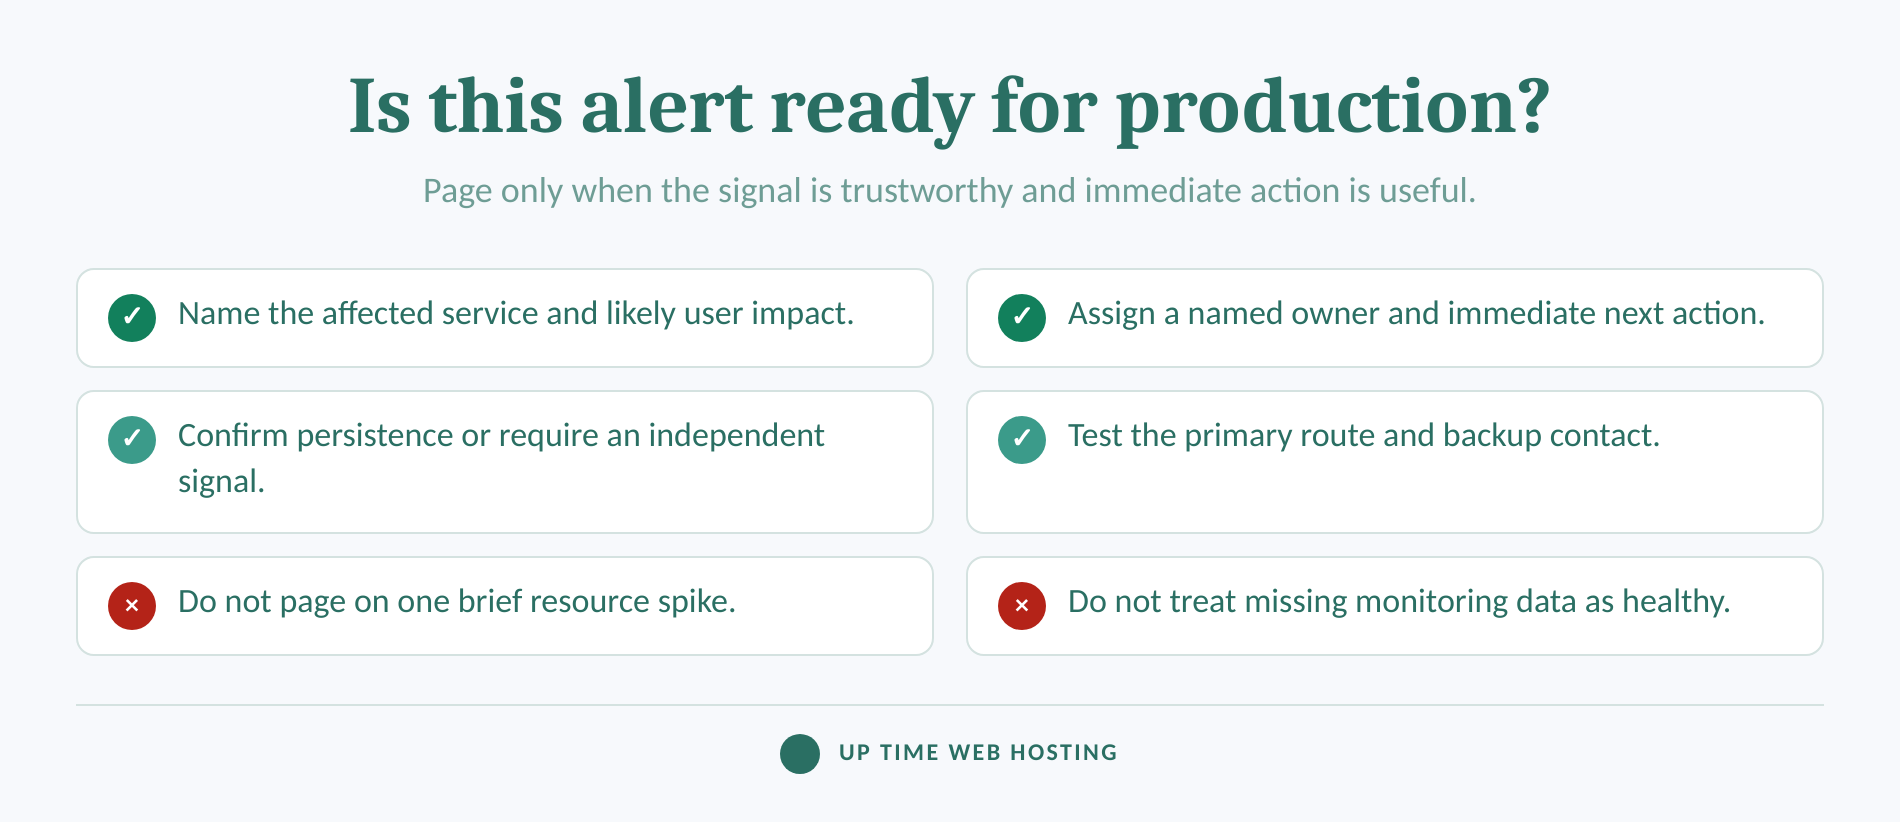
Set thresholds from the server's role, normal workload and time to failure rather than copying one percentage across every host. Combine a clear condition with duration, business impact, an owner and a documented next action.
Use this method:
- Record a baseline. Capture normal working hours, quiet periods, scheduled jobs and peak events before setting narrow limits.
- Define the risk. State what could fail if the condition continues and how much response time remains.
- Choose the route. Decide whether the rule pages, creates a ticket or records a trend.
- Require persistence or confirmation. A brief CPU spike may need no action, while a failed customer request confirmed by another signal may need immediate escalation.
- Set a recovery condition. Avoid repeated open and close notifications when a value sits near one boundary.
- Add context. Include the asset, service, current value, duration, related checks, recent changes, owner and runbook.
- Test the notification path. Confirm the primary and backup contacts receive and acknowledge a controlled test.
- Review noise. Remove alerts that never lead to action, or change their route to a ticket or report.
There is no universal CPU, memory or disk percentage that fits every Linux server. A database host, batch worker and lightly used web server can respond very differently to the same raw utilisation. Hard limits such as expiring certificates or storage exhaustion still need warning points that leave enough time to act.
Google's monitoring guidance warns that frequent, low-value pages train responders to skim or ignore alerts. Google's incident-management guidance recommends alerts that are timely, actionable and based mainly on user-visible symptoms, while allowing preventive alerts where a hard resource limit could cause sudden failure.
The best threshold is not the most sensitive one; it is the one that gives the right person enough time and evidence to act.
What are the best Linux server monitoring commands for a quick check?
Use native commands to identify what is happening now, then compare the output with stored history. A command-line snapshot cannot show when a problem began or whether the same pattern occurred before.
A practical first pass is:
uptime: Check load averages and time since the last boot.top: Find busy processes and review CPU, memory and task states.free -h: Review available memory and swap use.vmstat 1: Sample runnable and blocked processes, swap activity, I/O and CPU modes.df -handdf -i: Check filesystem blocks and inodes.iostat -xz 1: Inspect device latency, queues and utilisation when the command is installed.systemctl --failed: List failed units.systemctl is-active SERVICE: Confirm a required service is running.journalctl -p warning..alert -b: Review higher-priority messages from the current boot.ss -sandss -lntup: Review socket summaries and listening services.dmesg --level=err,warn: Inspect current kernel warnings and errors.
Take several samples for rate-based commands. The first vmstat or iostat report may include averages since boot, while later reports cover the selected sampling interval.
Commands are diagnostic tools; dependable Linux server monitoring also needs history, external checks, alert routing and tested ownership.
Register your new domain name at competitive market prices including free domain add-ons like privacy, DNS Hosting, Custom Nameservers and Forwarding.
Always the best price and no nasty renewal price hikes.
Register A Domain Name
What else do businesses ask about Linux server monitoring?
Choose monitoring by coverage and operating responsibility rather than popularity. The following questions address the phrases businesses commonly use when comparing Linux monitoring options.
What is the best system monitor tool for Linux?
There is no single best system monitor for every Linux server. Use native commands for live diagnosis, a central collector for history and alerting, and an external check for the service users reach. The best choice is the one the responsible team can maintain, secure, tune and act on.
What are the monitoring tools in Linux?
Linux includes commands for processes, memory, storage, services, logs and sockets. A practical first set is top, free, vmstat, df, systemctl, journalctl, ss and dmesg; iostat adds detailed device performance when installed. Commands are diagnostic tools, so continuous monitoring still needs historical collection and alert routing.
What is the best monitoring tool for servers?
The best monitoring tool for servers depends on operating systems, applications, scale, retention, security controls and who responds to alerts. For business-critical infrastructure, choose coverage before interface design: external availability, internal metrics, service checks, logs, notification testing, ownership and escalation must all work together.
What is the best monitor for Linux?
For a Linux server, the best monitor is not the prettiest local screen. It is a monitored system that detects user-visible failure, stores enough history for diagnosis, checks the health of its own data collection and reaches a named responder. Native terminal tools remain useful when that responder starts investigating.
The best monitoring arrangement is the one that turns a meaningful Linux signal into a timely, owned and verifiable response.
What should you do next?
Write a one-page matrix listing each critical service, its external check, internal evidence, severity, owner and permitted response. Trigger one harmless test alert and follow it through notification, acknowledgement, investigation and verified closure.
If the business needs monitoring connected to managed security and protection, review it monitoring and confirm the exact assets, service hours, acknowledgement targets, access, remediation authority, exclusions and reporting before relying on it.
The next useful step is to test one alert from detection to verified recovery and fix every gap the test exposes.