In short
To improve Speed Index in WordPress, make the above-the-fold area render sooner: reduce server delay, streamline critical CSS, keep the hero image discoverable and high priority, show fallback text while fonts load, and delay non-essential JavaScript. Test after each change so one optimisation does not hide another problem.
Key takeaways
- A fast Lighthouse Speed Index is 3.4 seconds or less on mobile and 1.3 seconds or less on desktop, according to Chrome's Speed Index documentation. (developer.chrome.com)
- Speed Index contributes 10% of the documented Lighthouse Performance score, so it should not be improved at the expense of LCP, responsiveness or layout stability. (developer.chrome.com)
- A likely hero or LCP image should be discoverable in the initial HTML, should not use lazy-loading and may need
fetchpriority='high'. - Render-blocking CSS, invisible web-font text and early JavaScript execution can delay visible content even when the files themselves are not especially large.
- Lighthouse is lab data that naturally varies, so compare several controlled runs and use field data to judge real visitor experience. (developers.google.com)
Table of contents
- What does Speed Index measure in WordPress?
- Which WordPress changes should you make first?
- Is the hero image loading too late?
- Is CSS blocking the first paint?
- Are web fonts hiding visible text?
- Is JavaScript delaying above-the-fold content?
- Is the server responding too slowly?
- Should you chase Speed Index by itself?
- How should you retest Speed Index after each fix?
- When is a WordPress speed plugin not enough?
- What else should you know about WordPress Speed Index?
- What should you do next?
Speed Index problems are rarely solved by turning on every optimisation setting. The useful question is simpler: what prevents the browser from drawing the first screen sooner?
Work from the beginning of the loading path. A late hero image cannot start earlier if the HTML is late. Critical CSS cannot paint quickly if another stylesheet or synchronous script blocks it. A cache plugin cannot repair a theme that hides the page until JavaScript runs.
What does Speed Index measure in WordPress?
Speed Index measures how quickly the visible part of a page fills in during a controlled Lighthouse load. Speed Index is a lab metric reported in seconds, not a Core Web Vital or a direct record of every visitor's experience. Chrome explains that Lighthouse records the loading page and calculates its visual progression between frames. (developer.chrome.com)
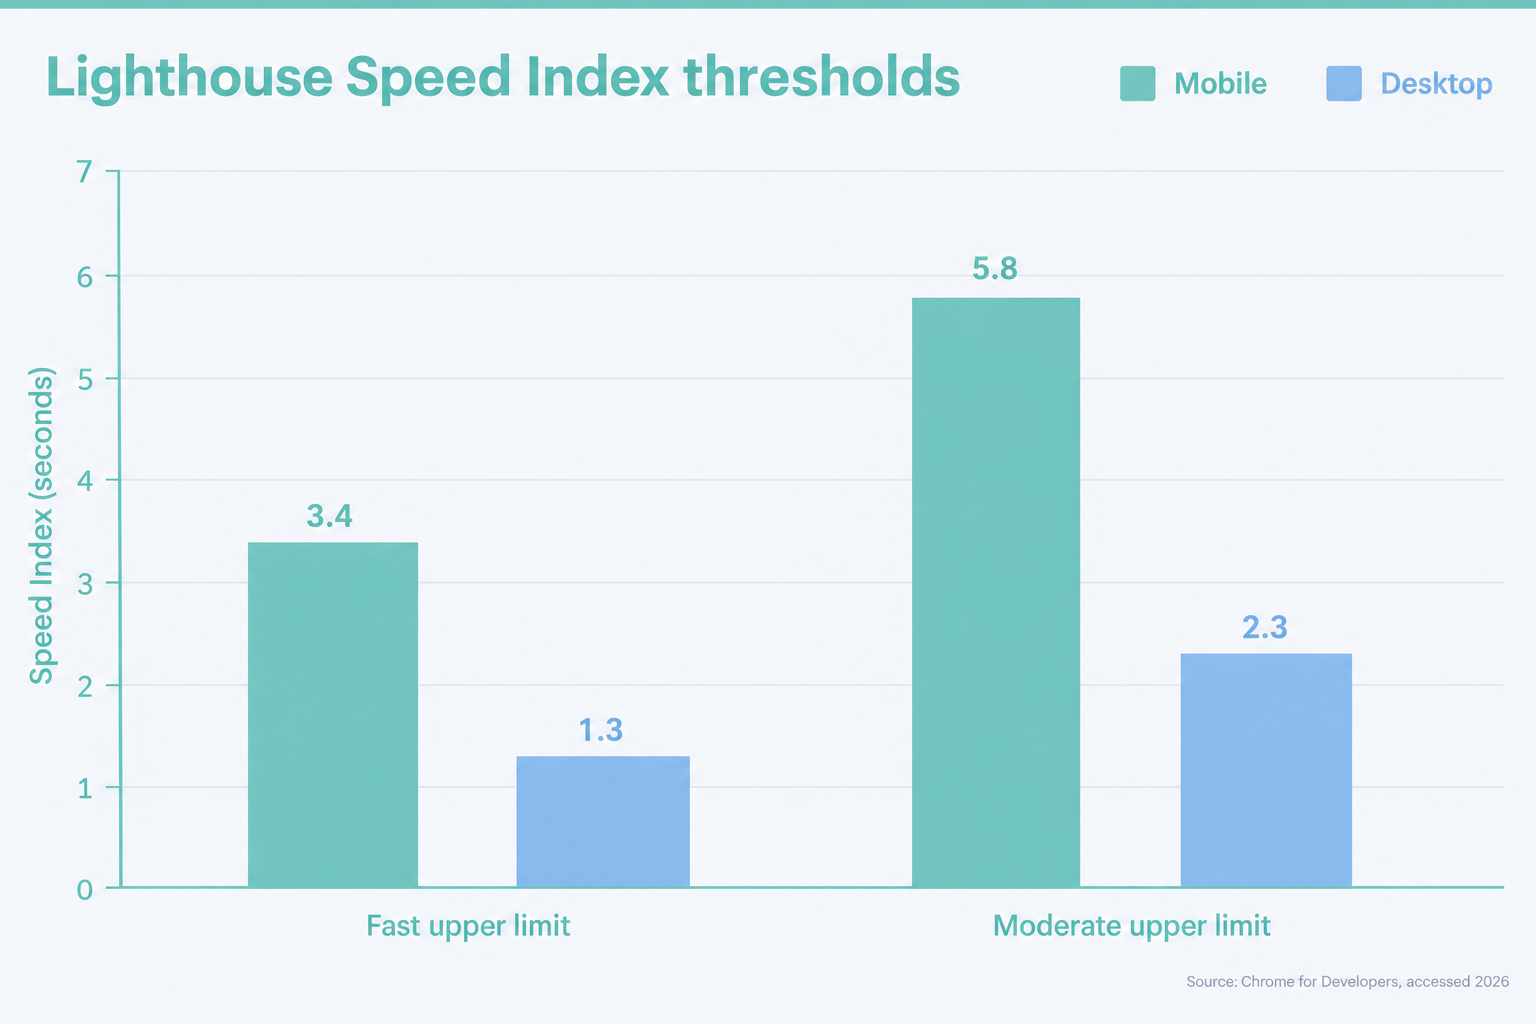
The documented mobile ranges are fast at 3.4 seconds or less, moderate from 3.4 to 5.8 seconds and slow above 5.8 seconds. Desktop testing uses much tighter ranges: fast at 1.3 seconds or less, moderate from 1.3 to 2.3 seconds and slow above 2.3 seconds. (developer.chrome.com)
Open the Lighthouse filmstrip instead of reading the number alone. A page may show its header quickly but leave the main heading, hero image or product grid blank. Another page may paint steadily from the start. Both can finish at a similar time, but the second page generally produces a better Speed Index because useful pixels appeared earlier.
Run mobile and desktop tests separately. A desktop result does not prove that a mobile visitor receives the same image, menu, font or script path.
Treat Speed Index as a film of visible progress, not a single verdict on the whole site.

Performance you can feel, backed by clients who depend on it. Read how our support and uptime create long‑term customer success.Power Your Business with Better Hosting
Which WordPress changes should you make first?
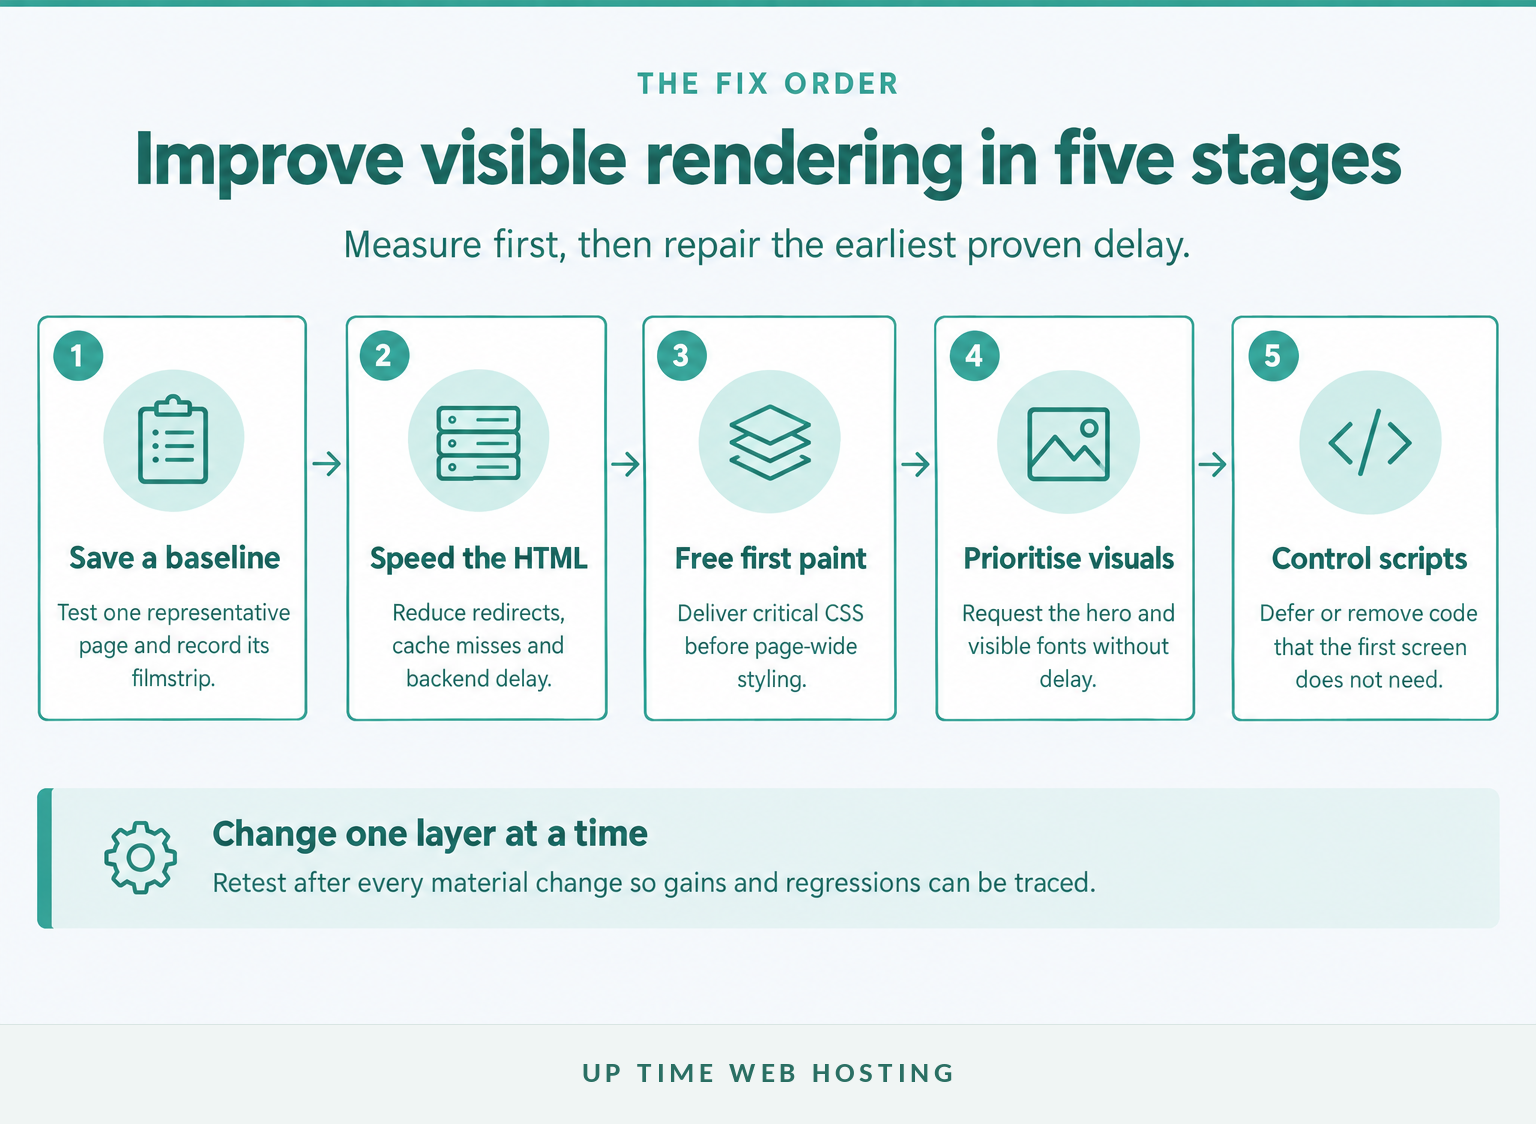
Fix the critical path in this order: establish a baseline, reduce document delay, remove first-paint CSS blockers, prioritise the hero image and visible fonts, then control non-essential JavaScript. This order matters because every image, font and stylesheet starts after the browser receives enough HTML to discover it.
Choose one representative slow page before changing settings. Test it while logged out, save the report and record Speed Index, First Contentful Paint, Largest Contentful Paint, Total Blocking Time and the document response. A broader guide to testing website performance explains how to compare lab results, field data and network waterfalls.
Use the visible symptom to decide where to begin:
| What the filmstrip or report shows | Likely bottleneck | First action |
|---|---|---|
| The screen stays blank before anything appears | HTML response, blocking CSS or synchronous JavaScript | Check document latency and render-blocking requests |
| Text appears but the hero remains empty | Late image discovery, lazy-loading or an oversized source | Inspect the hero request and image attributes |
| The heading area stays blank until the typeface arrives | Font blocking | Configure font-display and review critical font requests |
| The page appears, then freezes or reveals sections late | JavaScript execution or client-side rendering | Remove, defer or delay non-essential scripts |
| The first run is poor but repeat views are fast | Missing or ineffective caching | Compare uncached and warm-cache requests |
Do not change caching, minification, image conversion and script delay together. If the result improves, there will be no reliable way to identify which setting helped. If the layout breaks, there will be no clear rollback point.
The fastest route to a better Speed Index is to fix the earliest proven delay before touching later resources.
Is the hero image loading too late?

A likely hero or LCP image should be discoverable in the initial HTML, correctly sized for the viewport and excluded from lazy-loading. Use fetchpriority='high' only for the most important visible image, then confirm that a theme, builder or optimisation plugin has not added conflicting attributes. web.dev's LCP guidance warns that lazy-loading an LCP image creates unnecessary resource delay. (web.dev)
WordPress Core has automatically added fetchpriority='high' to an image it considers a likely LCP candidate since WordPress 6.3. WordPress also avoids combining high fetch priority with lazy-loading because the two instructions conflict. Custom templates and page builders can still bypass or override this behaviour, so inspect the final page source rather than assuming that WordPress handled the correct image. (make.wordpress.org)
A suitable image element may look like this:
“`html
“`
Do not add loading='lazy' to that likely hero image. Keep lazy-loading for images below the first screen.
WordPress normally generates srcset and sizes information for Media Library images, allowing the browser to select an appropriate source for the viewport. If a template prints the full original upload or uses a CSS background instead, the browser may download more data or discover the image later than necessary. WordPress responsive image documentation explains the native source-selection behaviour. (developer.wordpress.org)
For a CSS background hero, preload may help because the image is otherwise discovered only after the stylesheet arrives. Preload only a late-discovered critical resource, not every large image. Too many preloads compete for the same early bandwidth. (web.dev)
Review the rest of the image pipeline as part of WordPress performance optimisation: upload sensible dimensions, preserve responsive sources and use efficient output formats supported by the site and server.
The likely hero or LCP image must be discoverable early, sized correctly and never lazy-loaded.
Host your website with our 5-star rated, cPanel website hosting plans.
Super fast servers, with security included and hosted in your choice of Australian Data Center.
View cPanel Plans
Is CSS blocking the first paint?
CSS can block rendering because the browser needs styles before it can safely draw the page. The goal is not to remove every stylesheet, but to deliver the small amount needed for the first screen before page-specific and below-the-fold rules.
Chrome's 2025 render-blocking requests insight recommends deferring requests that are unnecessary for first paint, inlining small critical styles and reducing CSS or scripts to what the initial view needs. Chrome also warns that critical CSS inlining is an advanced technique that can introduce bugs if implemented poorly. (developer.chrome.com)
For WordPress, inspect the files listed under render-blocking requests and ask four questions:
- Does the stylesheet affect the header, navigation, heading, hero or first visible form?
- Is a plugin loading its stylesheet on pages where the plugin has no visible output?
- Is a page builder shipping a site-wide bundle for a small component?
- Are two optimisation systems both combining, minifying or rearranging the same CSS?
A critical CSS feature should create page-aware first-paint rules, load the remaining CSS without hiding content and refresh its output when templates change. Test mobile menus, responsive breakpoints, sticky headers, forms, cookie controls and logged-in administration after enabling it.
Removing unused CSS can help, but deleting rules based on one recorded load can break content revealed by a menu, tab, validation message or logged-in state. Use Chrome DevTools Coverage as evidence, then check interactive states before removing a stylesheet or selector permanently.
Critical CSS should arrive first; page-specific and below-the-fold CSS should not hold the first screen hostage.
Are web fonts hiding visible text?
Web fonts can worsen Speed Index when the browser leaves headings or body text invisible while a font downloads. Configure a visible fallback with font-display, then preload only the font file that is genuinely critical to the first screen.
The web.dev guide to font optimisation says font-display: swap shows fallback text immediately instead of blocking visible text. It also explains that fallback and optional can be useful when a site can accept stricter limits on whether the custom font appears during the first visit. (web.dev)
A basic font rule is:
“css @font-face { font-family: 'Site Sans'; src: url('/fonts/site-sans.woff2') format('woff2'); font-style: normal; font-weight: 400; font-display: swap; } “
Preloading every font family, weight and style can make performance worse by taking bandwidth from CSS and the hero image. Start with one WOFF2 file used by the main heading or visible body copy. Remove unused weights and character sets where the font licence and implementation permit it.
A fallback font with very different character widths can cause text to reflow when the web font arrives. Match fallback metrics where practical and check Cumulative Layout Shift as well as Speed Index. Font work is successful only when the text appears quickly without creating distracting movement.
Visible text should use a fallback immediately rather than wait behind a custom font download.
Is JavaScript delaying above-the-fold content?
JavaScript that does not create the header, hero or first visible interaction should not block those elements from appearing. Remove unused scripts first, defer dependency-aware scripts and delay optional third-party features until they are needed.
JavaScript costs more than download bytes. The browser must parse, compile and execute it, mostly on the main thread, where long work can also delay rendering. Chrome's guidance identifies unused code, large bundles and early execution as common contributors. (developer.chrome.com)
WordPress supports defer and async loading strategies through wp_enqueue_script(). The dependency tree is considered when WordPress selects the eligible final strategy. defer preserves document order and waits until HTML parsing is complete, while async runs as soon as a file is available and does not guarantee execution order. WordPress script-loading documentation provides the current API details. (developer.wordpress.org)
A theme or custom plugin can request deferred loading like this:
“php wp_enqueue_script( 'theme-interactions', get_theme_file_uri( '/assets/js/interactions.js' ), array(), wp_get_theme()->get( 'Version' ), array( 'strategy' => 'defer', 'in_footer' => true, ) ); “
Do not add async or defer blindly to scripts inserted by a plugin. A form, menu, gallery, product variation selector or checkout component may depend on another file or inline configuration. Test the affected task, not just the page's appearance.
Third-party chat, advertising, analytics, embedded media and tracking code can consume bandwidth and main-thread time before visible content is complete. Chrome's current third-party performance insight recommends reducing and deferring third-party code so the page's own content receives priority. (developer.chrome.com)
JavaScript that does not build the first screen should not compete with the first screen.
Register your new domain name at competitive market prices including free domain add-ons like privacy, DNS Hosting, Custom Nameservers and Forwarding.
Always the best price and no nasty renewal price hikes.
Register A Domain Name
Is the server responding too slowly?
If the initial HTML is late, every stylesheet, image, font and script begins late. Lighthouse's document request insight flags server response taking more than 600 milliseconds, while web.dev uses 800 milliseconds or less as a rough good TTFB target because full TTFB also includes connection work and redirects. (developer.chrome.com)
The distinction matters. Lighthouse's 600 millisecond check is for the server response portion of the main document request. Field TTFB can also include DNS, connection setup, TLS and redirects.
Use the internal guide to server response time for a broader explanation, then compare at least these two states:
- An uncached or deliberately bypassed request, which exposes PHP, database and application work.
- A warm, logged-out request, which shows whether full-page or edge caching is serving reusable HTML effectively.
Common WordPress causes include slow plugin work, expensive database queries, external API calls during page generation, cache misses and exhausted hosting resources. Redirect chains and uncompressed HTML add further delay before visible resources can begin. Chrome's document request latency guidance recommends removing redirects, improving application or database work, using suitable infrastructure and enabling text compression. (developer.chrome.com)
Full-page caching is especially useful for public, non-personalised pages. Logged-in screens, carts, checkouts and account areas need rules that preserve current user data. A cache that serves another customer's state is not a performance improvement.
If a cached public page still has a poor document response, inspect hosting resources, cache configuration, PHP work and database activity before spending more time minifying front-end files.
A slow document response delays every image, font and stylesheet that follows.
Should you chase Speed Index by itself?
No. As of November 2026, the documented Lighthouse scoring model assigns Speed Index 10% of the Performance score, compared with 30% for Total Blocking Time and 25% each for Largest Contentful Paint and Cumulative Layout Shift. (developer.chrome.com)
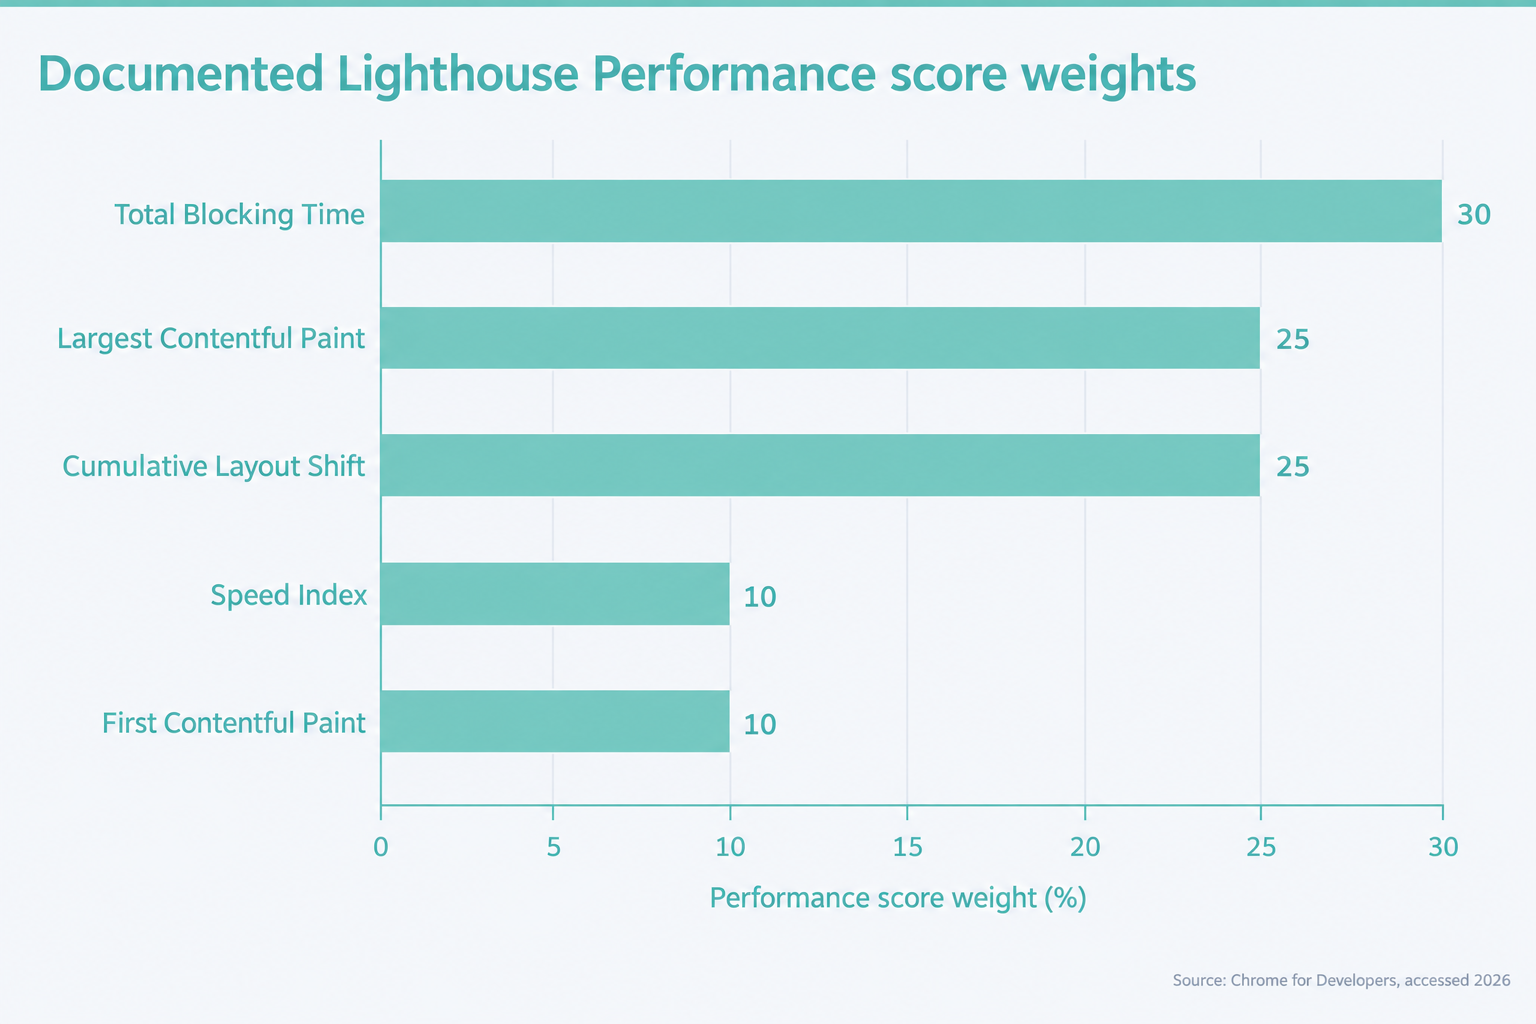
A change that improves visual progress but creates layout movement, blocks interaction or delays the largest content element is not a good trade. Watch the whole metric group and verify that the page still works.
PageSpeed Insights separates Lighthouse lab diagnostics from Chrome User Experience Report field data. Field data represents real visitors over a trailing 28-day collection period, while lab data uses a simulated device and network to expose problems under repeatable conditions. Speed Index appears in lab data, but it is not one of the Core Web Vitals used for the field assessment. Google's PageSpeed Insights documentation explains the distinction. (developers.google.com)
Improve Speed Index without sacrificing LCP, responsiveness or layout stability.
Experience Microsoft 365 Business Standard for free for 30 days.
Up to 25 users with full access to email, OneDrive and Teams. Includes full versions of desktop apps of Outlook, Word, Excel, PowerPoint and more.
Try Microsoft 365
How should you retest Speed Index after each fix?
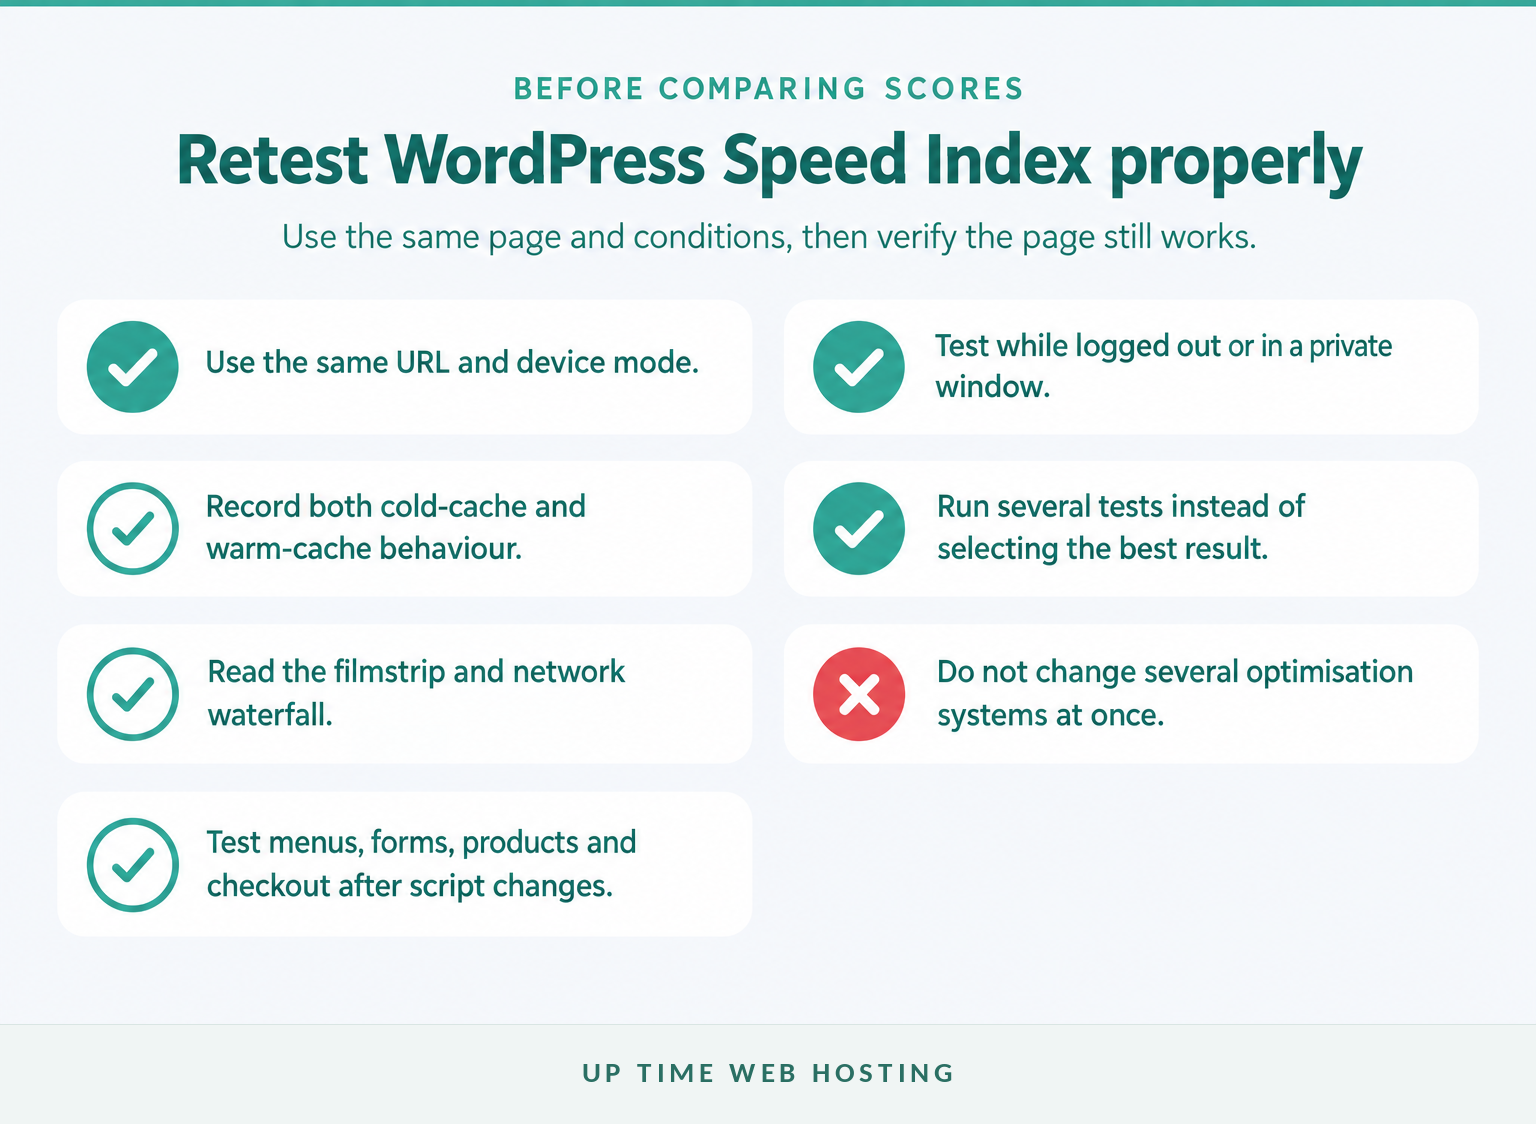
Retest the same URL with the same device mode after each meaningful change, then compare several runs rather than choosing the best score. Check both the metric and the filmstrip because a lower number is useful only when meaningful content genuinely appears sooner.
Use this sequence:
- Confirm the exact URL. Different templates can load different themes, blocks, product scripts and third-party features.
- Test while logged out. Administrator toolbars and cache bypasses can create a different loading path from the one visitors receive.
- Record a cold and warm state. The first request exposes cache misses; repeat requests show what reusable caching delivers.
- Run several tests. Lighthouse scores can change because of network routing, server load, advertisements, testing hardware and background activity. (developer.chrome.com)
- Read the filmstrip and waterfall. Identify when the heading, hero and first useful controls appear, then trace the request blocking them.
- Test the page's main task. Open the menu, submit the form, select a variation or complete a staging checkout after changing scripts or CSS.
- Watch field data over time. A fresh lab result appears quickly, but the field section reflects a rolling real-user period rather than an instant before-and-after test. (developers.google.com)
Test more than the homepage. Include a normal article or service page and, where relevant, a product, cart or checkout page. Improving a lightweight homepage does not prove that the site's heaviest template improved.
Keep a short change log with the date, URL, settings changed, cache state and result range. That record makes regressions much easier to identify after a theme, plugin or content update.
A repeatable test sequence is more useful than the best single score from a lucky run.
When is a WordPress speed plugin not enough?
A speed plugin may be enough when the measured problem is page caching, compression, image delivery or straightforward asset loading. It is not enough when the delay comes from the hosting environment, theme output, database work, plugin-specific code, third-party services or a hero resource hidden behind a template decision.
Escalate beyond plugin settings when:
- The initial document remains slow after the cache is warm.
- Defer or delay settings repeatedly break navigation, forms or checkout.
- The likely LCP image is generated through JavaScript or a complex slider.
- Critical CSS is stale, missing or different for each template state.
- Database or PHP work dominates the uncached request.
- Several plugins load site-wide assets that require conditional code changes.
- The site needs before-and-after testing across several important templates.
Do not stack several optimisation plugins that all manage caching, CSS and JavaScript. Overlapping systems make exclusions, cache purges and regressions harder to trace.
If the remaining work requires theme edits, server logs, query analysis or coordination between hosting and front-end layers, the guide to WordPress speed optimisation services explains what a useful technical scope should cover. (uptimewebhosting.com.au)
A plugin is enough only when it can fix the measured bottleneck without creating conflicts.
What else should you know about WordPress Speed Index?
The questions below cover the thresholds and WordPress decisions that commonly appear beside this topic in search. Each answer assumes that testing is being performed on a representative page while logged out.
How can I optimize my WordPress site for improved speed?
Start with a repeatable mobile Lighthouse test, then fix the critical path in order: server response, render-blocking CSS, the hero image, fonts and non-essential JavaScript. Use page caching and correctly sized responsive images, remove unused plugin assets, and retest after each change instead of installing several optimisation tools at once.
What is a good speed index?
A good Lighthouse Speed Index is 3.4 seconds or faster on mobile and 1.3 seconds or faster on desktop. Results from 3.4 to 5.8 seconds on mobile, or 1.3 to 2.3 seconds on desktop, need improvement. Test the same page several times because lab results naturally vary.
What is a good page speed index?
A good page Speed Index depends on the Lighthouse test mode. The documented green threshold is no more than 3.4 seconds for mobile and 1.3 seconds for desktop, but the metric is only one lab signal. Also check LCP, Total Blocking Time, layout stability and real-user field data.
How to optimize WooCommerce speed?
Improve WooCommerce Speed Index by testing the shop, product, cart and checkout separately because each template loads different assets. Prioritise full-page caching only where it is safe, optimise product images, unload shop scripts from unrelated pages, reduce third-party payment or tracking code, and confirm that cart and checkout functions still work.
The best speed work starts with the visible critical path, then checks WooCommerce or page-specific behaviour separately.
What should you do next?
Start with one representative slow page and record its mobile filmstrip, Speed Index, document response and render-blocking requests. Make the first change at the earliest proven delay, retest under the same conditions and keep the change only if visible content appears sooner without breaking the page.
When updates, security checks, backups and performance tracking have become recurring operational work, managed WordPress maintenance provides an ongoing care option. Confirm which performance work is included for the specific site before relying on a maintenance plan to resolve an existing technical bottleneck. (uptimewebhosting.com.au)
The next useful action is one measured change, not another untested optimisation switch.