
Australians downloaded 14.2 million terabytes of data across retail broadband and mobile services in the three months to 30 June 2024, 10% more than the 12.9 million terabytes recorded in the same period a year earlier, according to ACMA's measurement of how Australians use the internet. NBN connections carried 81% of that volume, mobile services 10% and non-NBN fixed services 9%.
That's the whole country, not your website. It still reframes the question. Those asking how much bandwidth does a website need expect a single number in gigabytes, and a hosting comparison page usually gives them one. The honest answer needs two numbers and a third check: the monthly bucket, the busy evening hour, and everything your business sends the other way through uploads and backups. Get those three right and the plan choice stops being a guess.
Table of Contents
- What Website Bandwidth Actually Measures
- A Monthly Transfer Table You Can Use Today
- How to Estimate Bandwidth from Your Own Site
- Peak Hour Load Is a Separate Limit
- Uploads Media and Back-Office Traffic
- Australian Site Examples with Real Numbers
- Match the Allowance to Your Next Plan

Performance you can feel, backed by clients who depend on it. Read how our support and uptime create long‑term customer success.Power Your Business with Better Hosting
What Website Bandwidth Actually Measures
On a hosting plan, bandwidth is the total volume of data your server sends and receives across a billing period. It isn't the speed of your NBN connection, and it isn't the size of your homepage. It's the accumulated weight of every request that touches your account: pages, images, stylesheets, scripts, fonts, price lists, product photos, form submissions, nightly backups and the automated crawlers that read the site whether or not a person is there.
Think of a page as a parcel. A 2 MB page is one parcel leaving the post office. Bandwidth is every parcel posted in the month, including the ones sent to the same address twice because someone reloaded a page, opened it on a phone and a laptop, and came back the next day to check the address. The post office doesn't care that the parcels look identical. It counts the weight.
Why a quiet page still adds up
A 2 MB page loaded 100,000 times in a month moves about 200 GB. That's before the extra CSS and JavaScript, the hero image that never got compressed, a video embed, a downloadable catalogue, bots and repeat visits. Nothing about such a page looks heavy on a phone screen, which is why page size alone is a poor proxy for monthly transfer.
Practical rule: measure the bytes a browser actually downloads, not the file size of the HTML document. The difference is usually three to five times.
A five-page brochure site with a few thousand visits a month looks tiny beside those numbers, and on page views alone it is. The weight arrives in the extras: a monthly newsletter sent from the same account, a price list people download, a gallery of original photos straight off a camera, and backups leaving the server every night. None of that shows up in a page-view count, and all of it shows up on the meter. What web hosting actually means explains how transfer sits alongside the other allowances on a plan, including disk space, memory and CPU, because those limits tend to bite before gigabytes do.
The table below gives you a starting figure you can copy today.
A Monthly Transfer Table You Can Use Today
Every row here comes from one multiplication: monthly page views × average page size = transfer, worked at 1,000 MB to the gigabyte, which is how most hosting meters report it. The buffer column adds half again for crawlers, a campaign week, a gallery you haven't built yet and the gap between a template and a finished page.
| Monthly page views | Average page size | Transfer before overhead | With a 50% buffer |
|---|---|---|---|
| 1,000 | 1 MB | 1 GB | 1.5 GB |
| 5,000 | 2 MB | 10 GB | 15 GB |
| 10,000 | 2 MB | 20 GB | 30 GB |
| 10,000 | 3 MB | 30 GB | 45 GB |
| 10,000 | 5 MB | 50 GB | 75 GB |
| 30,000 | 2 MB | 60 GB | 90 GB |
| 30,000 | 10 MB | 300 GB | 450 GB |
| 100,000 | 2 MB | 200 GB | 300 GB |
The rows worth memorising
10,000 views at 3 MB is 30 GB, or 45 GB with the buffer. That's an ordinary small business: five pages, a few photos on each, a contact form. Nothing on that site feels heavy to the person browsing it.
30,000 views shows how page weight compounds. At 2 MB the month costs 60 GB. Put the same visitors on a 10 MB homepage, the kind assembled from uncompressed hero images and an embedded video, and the month costs 300 GB. Same traffic, five times the transfer, and the only variable that changed was the design.
The buffer column is what separates a plan that survives a campaign from one that doesn't. If you advertise, run a physical sale, send a weekly newsletter or get a mention on local radio, take the buffered figure rather than the raw one. The raw figure describes a month that behaves.
A reality check from Australian connections
ACMA's telecommunications data file records average monthly data downloaded per NBN retail connection at 529 GB in June 2025, against 481 GB in June 2024. The same data breaks down by plan speed: 313 GB on 25 Mbps services, 530 GB on 50 Mbps and 669 GB on 100 Mbps.
Those describe household connections, streaming and all. They aren't a hosting allowance and shouldn't be pasted into one. What they do show is that media-heavy habits add up quickly, and a page stacked with high-resolution photos transfers far more than its word count suggests.
How to pick a row
Open your analytics, find monthly page views for the last three full months, and use the middle one. Then open your homepage in a browser, reload with the cache disabled, and read the transferred bytes in the network panel. Round up.
Pick the nearest row, then move one row higher if you're launching something. A row above your current traffic costs almost nothing. A row below it costs a slow site during the week that matters.
Host your website with our 5-star rated, cPanel website hosting plans.
Super fast servers, with security included and hosted in your choice of Australian Data Center.
View cPanel Plans
How to Estimate Bandwidth from Your Own Site
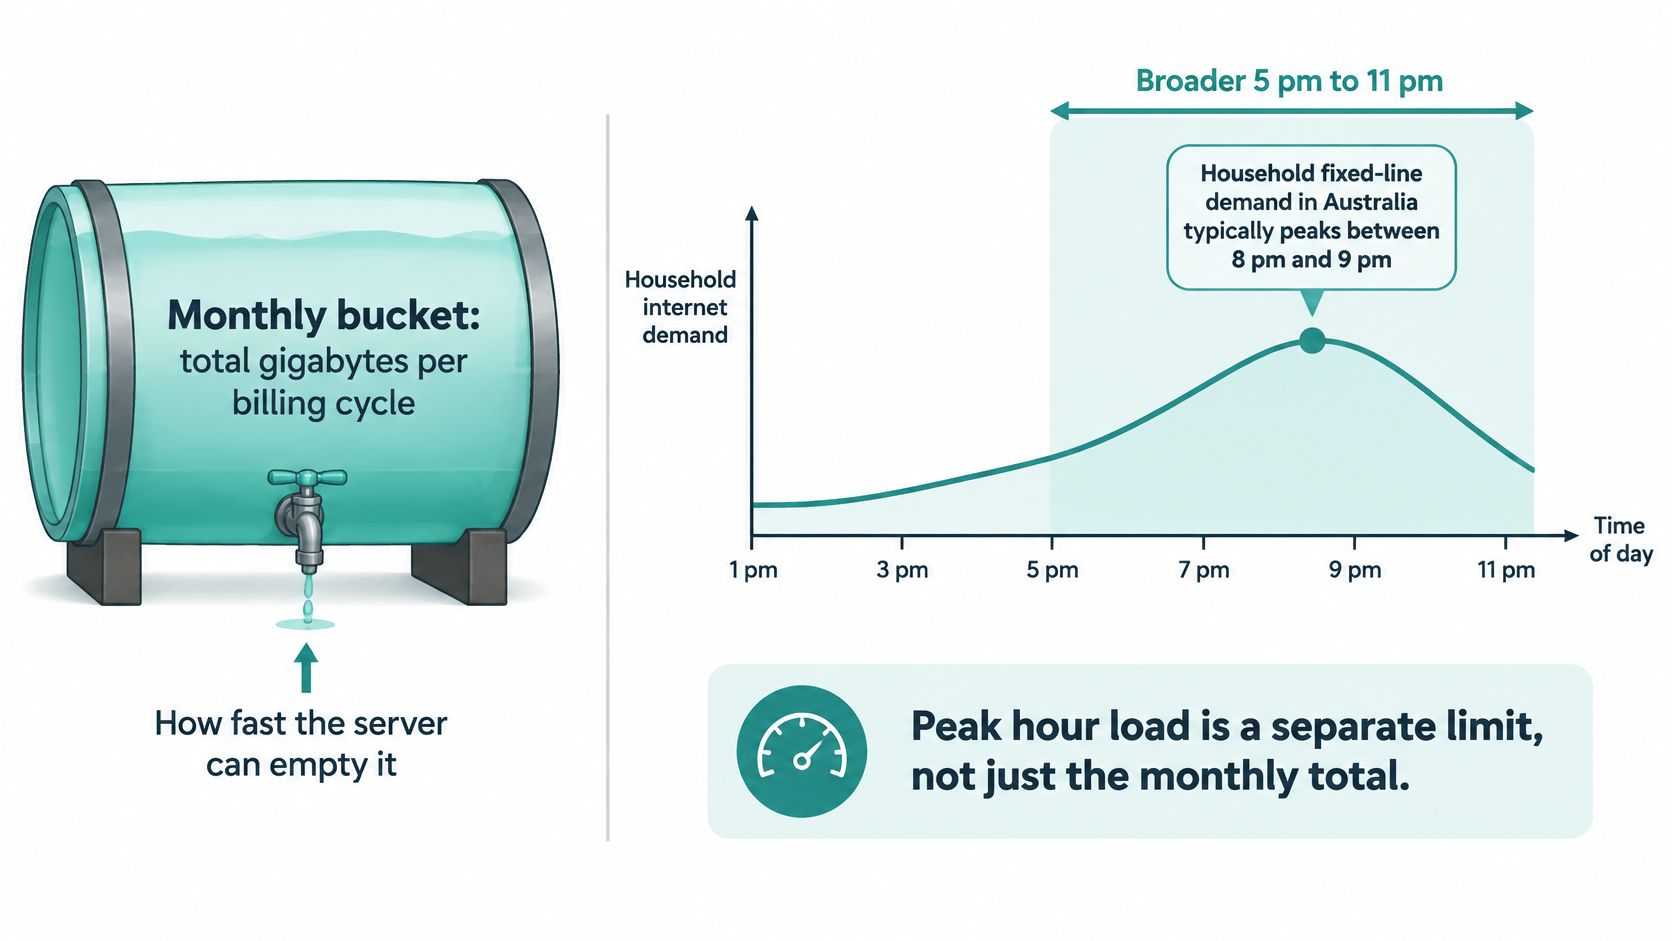
The gap between a monthly bucket and an hourly demand curve is worth keeping in view while you work through these steps, because the arithmetic only gets you to the first number.
Averages get you close. Your own numbers get you exact, and the rebuild takes about twenty minutes with the tools you already own.
- Export a normal month of page views. Use the middle of your last three months rather than the best or worst, and filter out any bot spike your analytics tool can exclude, because a crawler hitting 4,000 pages inflates the number you're about to multiply.
- Weigh the templates that carry the traffic. Open the homepage and two inner pages in your browser's network panel, reload with the cache disabled, and read the transferred bytes, then average them in megabytes. A category page and a product page often differ by double.
- Multiply and convert. Views × average megabytes ÷ 1,000 gives gigabytes. That's the whole formula, and it's the one figure a host can't argue with.
- Add what page weight hides. PDF price lists, hosted video, mail sent from the same account, form files and customer uploads all sit on the meter without appearing in a page view.
- Add room for the unexpected. Growth, crawlers and a sale week land in the same billing period, and a plan sized to your quietest month will meet your loudest one at the worst moment.
- Run the same sum for a campaign month. EOFY, a local festival, an event registration period or a news mention produces a different number, and that's the month you should be sizing against.
- Write the result beside the transfer graph. When someone adds a gallery in March, you'll know within a day whether it moved the line.
For national context, ACMA's trends in telecommunications report recorded 13.6 million terabytes downloaded across retail broadband and mobile services in the three months to June 2025, split between 11.6 million terabytes on the NBN, 1.5 million on mobile and 558,000 on non-NBN fixed services. None of that is your bill. A small site moving a few gigabytes a month is normal, and the national figure only matters here as proof that bytes accumulate.
The bandwidth and Awstats pages inside cPanel show the same story from the server side. Traffic monitoring tools explained walks through where those reports live and how to read the megabytes, hits and top referrers when your content changes.
Peak Hour Load Is a Separate Limit
A website can finish the month at 20 GB of a 50 GB allowance and still throw errors on a Tuesday evening. The monthly bucket and the busy minute are different limits, set by different parts of the stack. One is transfer volume. The other is how fast the server can hand data to everyone asking at once.
Australian demand clusters. Household fixed-line demand typically peaks between 8:00 pm and 9:00 pm, inside a broader 5:00 pm to 11:00 pm window, according to the Department of Infrastructure review of fixed-line broadband demand. Send a newsletter at 7:30 pm and your traffic arrives while the rest of the country is also online.
That same review records average NBN household downloads of 508 GB in June 2025, 10% up year on year, with uploads up 12%. National appetite keeps climbing, which is the argument for headroom rather than for panic.
The burst the monthly table never shows
Forty people opening a 3 MB page in the same minute move about 120 MB in that minute. Against a monthly allowance that's a rounding error. Against a small shared environment it's everything, because forty concurrent PHP requests, database queries and image resizes queue behind whatever else the server happens to be doing.
The question to ask isn't only how many gigabytes the month holds. It's how many visitors the site can serve in its busiest hour without latency or errors.
Caching and a CDN cut the repeat image hits, so a returning visitor on a warm cache pulls far less than a first-time one. Backups, admin logins and crawlers get no such benefit, and they don't schedule themselves around your peak. Meanwhile the business-side traffic shares the same server and the same connection.
When an Australian visitor sees a 503 in that window, the allowance is rarely the cause. What a 503 Service Unavailable error means explains what the browser is reporting and why a server sheds load instead of slowing to a crawl.
Plan for the busiest local event, a stock drop, enrolment day or a webinar. Watch latency and failed requests as closely as gigabytes, and note your own busy hour in analytics before you read a single plan limit.
Uploads Media and Back-Office Traffic
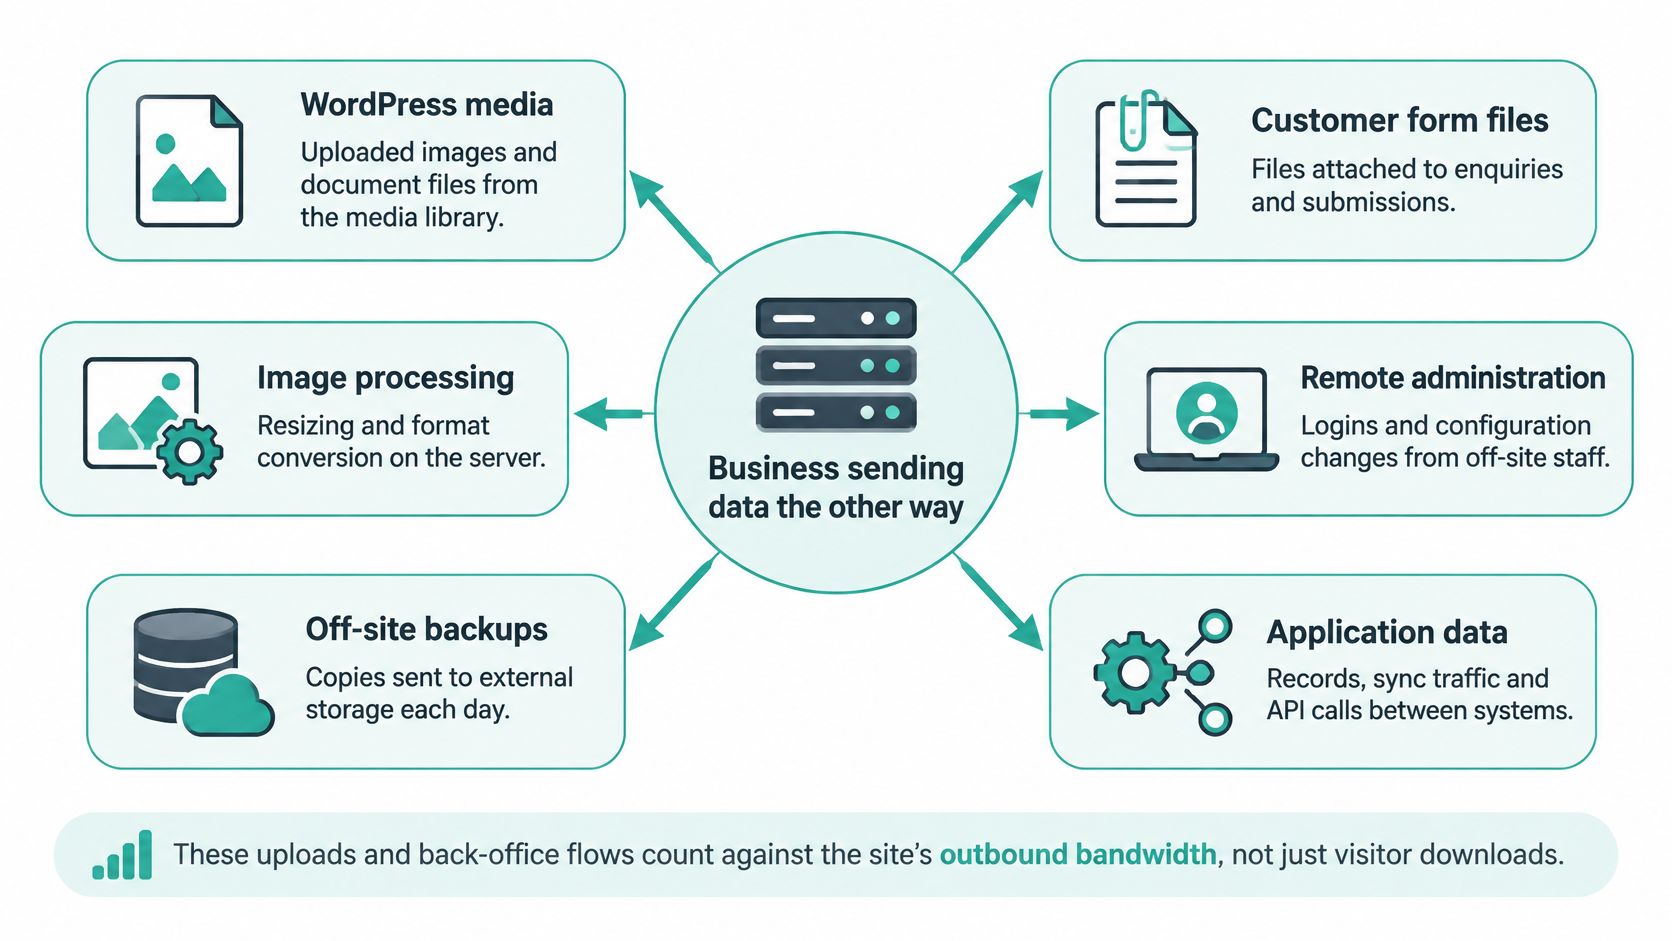
Visitor downloads are half the meter. The other half is your business sending data the other way, and it's the half most bandwidth guides skip entirely.
nbn's review of how Australians used the internet in 2025 puts the NBN's share of national downloads at 85% in the three months to June 2025. More telling for site owners, Microsoft Teams and Zoom represented 24% of NBN upload volume that year and average household upload traffic increased 12% year on year. The same article projects average NBN downloads could double by 2029 and uploads quadruple by 2032. A fixed recommendation written today will look quaint well before then.
A sum that never appears in page views
Say a site takes 200 customer forms a month at 3 MB each. That's 600 MB, which is nothing. Now add a nightly 2 GB off-site backup: thirty copies a month is roughly 60 GB before retention copies. The same quiet site now carries a large operational figure that no page-view estimate would ever predict.
On most shared accounts, backup and mail traffic is metered right alongside web traffic, which is why a transfer graph can sit far above what the visit numbers suggest. Check where your backups go and whether a copy leaves the server.
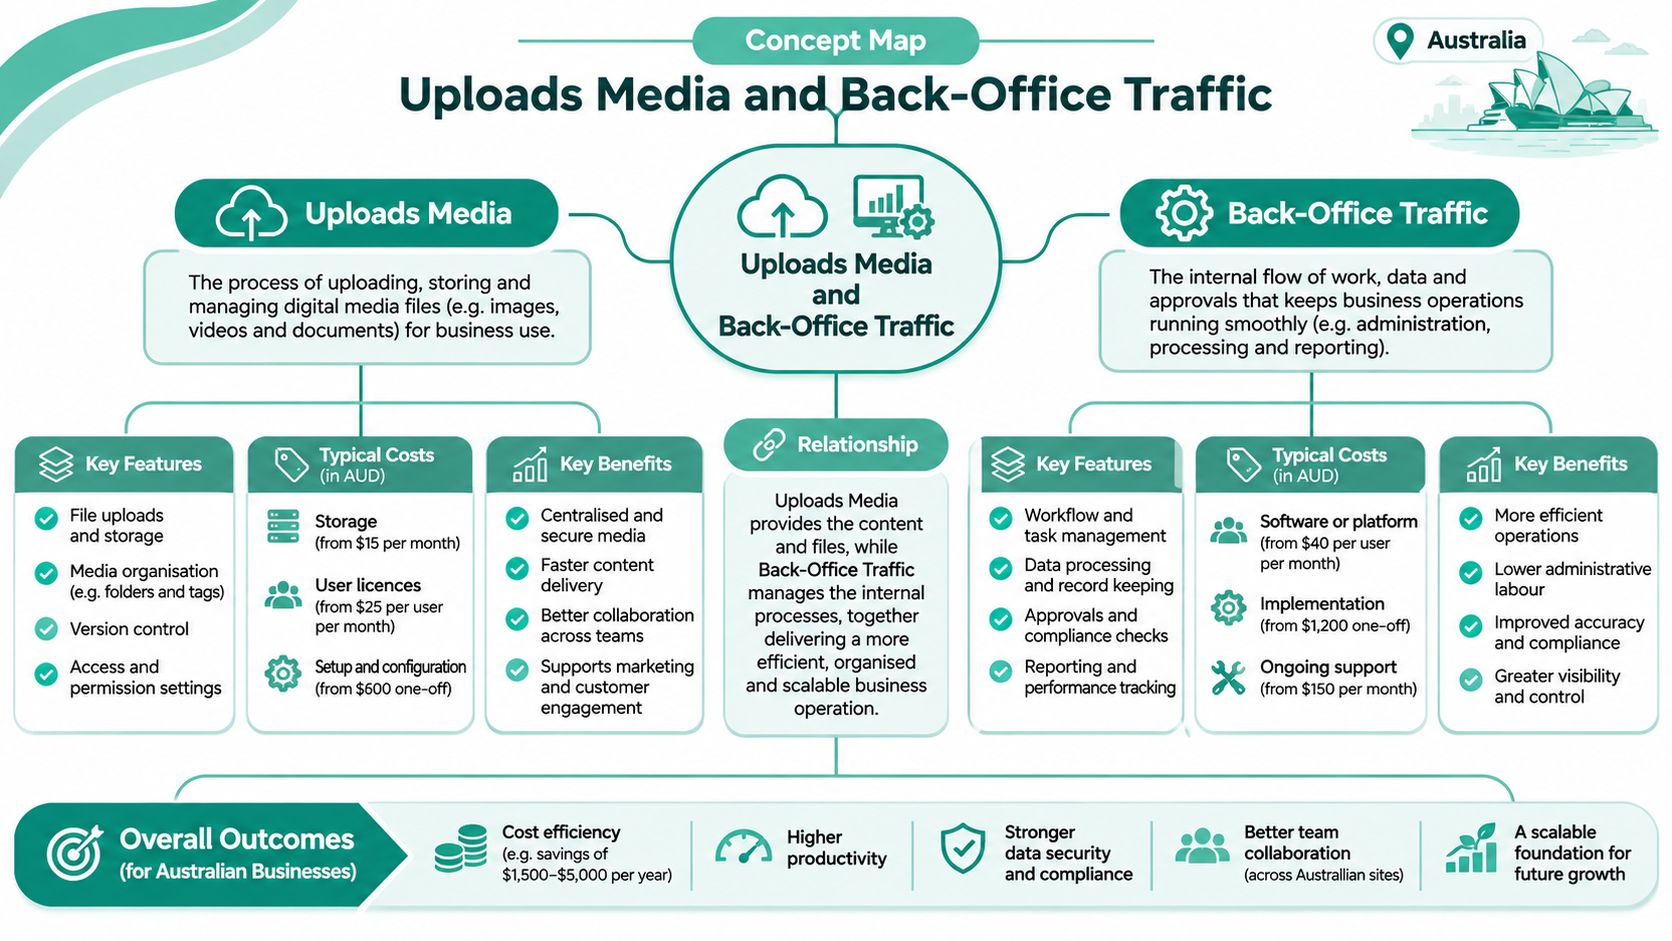
The question hosting pages rarely answer: how much bandwidth does the site need to run the business, not just to let visitors read pages?
WordPress media libraries, customer uploads, server-side image resizing and format conversion, remote administration and application data between systems all belong on the same list. A brochure site can stay on the low rows of the table for years. A modest online shop with forms, photo processing and video passes them inside a season.
Promotions that push people towards upload forms need care on both sides of the meter. If you run timed offers, an Easybox popup builder for fiber customers lets you schedule the message so it appears before the file upload starts, not while it's halfway through. Resizing images before they hit the media library, which how to improve website speed covers in detail, does more for that same meter than most caching plugins.
Watch four things after any change: monthly transfer, peak throughput, request latency and failed uploads. A rising transfer line with flat traffic usually means something new is being sent, not received.
Register your new domain name at competitive market prices including free domain add-ons like privacy, DNS Hosting, Custom Nameservers and Forwarding.
Always the best price and no nasty renewal price hikes.
Register A Domain Name
Australian Site Examples with Real Numbers
Four situations cover most Australian small sites, and none of them uses a round number you'd find on a sample hosting page.
| Scenario | Monthly transfer | Main driver |
|---|---|---|
| Suburban plumber brochure | About 3 GB | Form mail stays under 1 GB |
| Regional community site | About 25 GB | Full-size photo originals |
| Melbourne WooCommerce shop | About 49 GB | Staff photo uploads |
| Same shop at EOFY | About 73 GB | Sale traffic, not the template |
| Price-book downloads for the shop | About 6 GB extra | Files never in page weight |
The plumber. Two thousand views of a 1.5 MB services page works out at about 3 GB for the month. The enquiry form adds a few hundred megabytes at most, since nobody attaches a file to a quote request. A small plan handles this site comfortably, and the relevant limits will be disk space and mailboxes rather than transfer.
The regional community site. Eight thousand article views at 2.5 MB lands near 20 GB, and the photo gallery pushes it towards 25 GB. The lever here is originals: a 6 MB photo straight from a phone, shown at 600 pixels wide, transfers ten times what the page needs.
The Melbourne shop. Twelve thousand catalogue views at 4 MB comes to 48 GB before the staff add product photos, roughly 800 MB in a month. Call it 49 GB in a quiet month, and note that the driver is the content team rather than the template.
The same shop in EOFY week. The sale adds around 6,000 extra views, which at 4 MB each is another 24 GB. That month lands nearer 73 GB than 49 GB, and the plan that looked generous in February looks tight in June.
The fifth line. Four hundred customers downloading a 15 MB price book adds 6 GB that never appears in any page weight. Files like that are invisible until someone checks the download logs.
Which buffer applies depends on the site. A brochure site with a stable audience runs close to the raw figure. A shop, a community group running events or anyone advertising should work from the buffered column and then add the upload and backup line on top. Pick the closest scenario, swap in your own analytics, and re-measure after the next campaign rather than treating any of these figures as your bill.
Match the Allowance to Your Next Plan
Hold two numbers side by side before choosing anything: the buffered monthly transfer from the table, and the burst your busiest local hour creates. For most Australian brochure sites and small WordPress installs, the gigabyte line isn't the constraint that bites first. Disk space, PHP memory and a monthly visitor cap tend to fail before transfer does.
The plan mechanics are simpler than the maths. Standard website traffic is unlimited under a fair-use policy, and optional premium CDN traffic is usage-based with 1 GB per month included. Bandwidth itself is unlimited, with no additional data-transfer fees, so the figures in this article sit inside the plan rather than on an invoice. The cPanel hosting runs on a 40 Gbit connection, which speaks to the busy-minute problem rather than the monthly one.
If you're moving an existing site rather than starting fresh, web hosting for business covers what to check in a plan beyond the transfer allowance.
Write these five things down before you add video or move hosts:
- Monthly page views, taken from the middle of your last three months
- Measured page weight, read from the browser network panel, not guessed
- The table result, from the row nearest your traffic
- The buffered figure, for the campaign month rather than the quiet one
- The peak-hour check, being the busiest local hour your analytics can show
Two of those numbers decide the plan. The other three stop you being surprised by it.
UpTime Web Hosting runs Australian servers in Sydney, Melbourne, Brisbane and Perth with unlimited bandwidth under a fair-use policy, so the transfer figures you've calculated here won't reappear as an overage fee. If you'd like a second pair of eyes on whether your page weight, peak hour and backup traffic fit a cPanel plan or a WordPress plan built for campaign weeks, our local team will go through your analytics with you. Visit UpTime Web Hosting to compare plans and speak to someone who answers the phone in Australia.