
A monitored Australian webpage's average load time rose by 60% to about 13 seconds, while average latency across providers stayed generally below 12 milliseconds, in the ACCC Measuring Broadband Australia report. A faster plan would not have repaired that page. Server response time is the wait your application adds before the first byte leaves the origin. Latency, DNS and download sit beside it, and the ACCC's webpage loading figure blends all three. If you want to know how to reduce server response time, split those pieces for Australian visitors before you buy bandwidth or another CDN layer.
Table of Contents
- Where Your Response Time Goes and What Good Looks Like
- How to Measure TTFB From Four Australian Cities
- Server-Side Fixes for PHP, Caching and Resource Limits
- Database and Application Queries That Stall Responses
- When a CDN Helps and When Local Hosting Wins
- Confirm the Fix Holds Before You Call It Done

Performance you can feel, backed by clients who depend on it. Read how our support and uptime create long‑term customer success.Power Your Business with Better Hosting
Where Your Response Time Goes and What Good Looks Like
The wrong question is "is my broadband slow?" The useful question is whether the delay sits in time to first byte (TTFB) or on the visitor's path. TTFB is the wait between the browser sending a request and the first byte coming back. Latency is the round-trip time between a visitor and a test server, measured in milliseconds. A quick origin can still feel slow when DNS drags or the visitor sits on a long path, because webpage loading combines download speed, latency and DNS, not server processing on its own.
In the latest ACCC broadband-performance figures, average webpage loading time for eight popular Australian-based websites was 3.2 seconds in both all-hours and busy-hour testing, on the ACCC broadband performance data page. Treat that as a national baseline. If your full load sits well above it, server delay may be one contributor next to heavy images, blocking scripts or a slow resolver.
Benchmarks that separate the layers
| Metric | Target | What a miss usually points to |
|---|---|---|
| Time to first byte, cached page | 200-300 ms | Cache not serving, or origin too far from the visitor |
| Time to first byte, uncached page | Under 800 ms | Slow PHP, database or application code |
| Observed median TTFB, Sydney study of 20 sites | 287 ms | Reference only, not a pass mark |
| Extra first-byte delay when hosted outside the home region | 216 ms | Origin geography |
| DNS lookup | Under 50 ms | Slow or distant DNS resolver |
| Network latency to capital cities | Below 12 ms average | Last-mile connection rather than the server |
| Full mobile page load | 3 seconds | Images, scripts or backend waiting on mobile |
| Australia and New Zealand mobile load benchmark | 9 seconds, 15 seconds with backend waiting | Well above the 3 second mobile target |
| National average page load (ACCC, eight pages) | 3.2 seconds | Baseline to compare your site against |
Reading rule: High TTFB with low latency means the fix is on the server. A fine TTFB followed by slow rendering means images, scripts or third-party tags.
Read each miss against the layer that owns it. Cached TTFB outside 200-300 ms usually means the page cache never answered, or the origin is far from the visitor. Uncached TTFB past 800 ms means PHP, .NET or SQL is still doing fresh work on every hit. DNS over 50 ms points at the resolver. Latency above the capital-city average points at the last mile, not your code. I would not upgrade the plan until the failed row is the network row.
How to Measure TTFB From Four Australian Cities
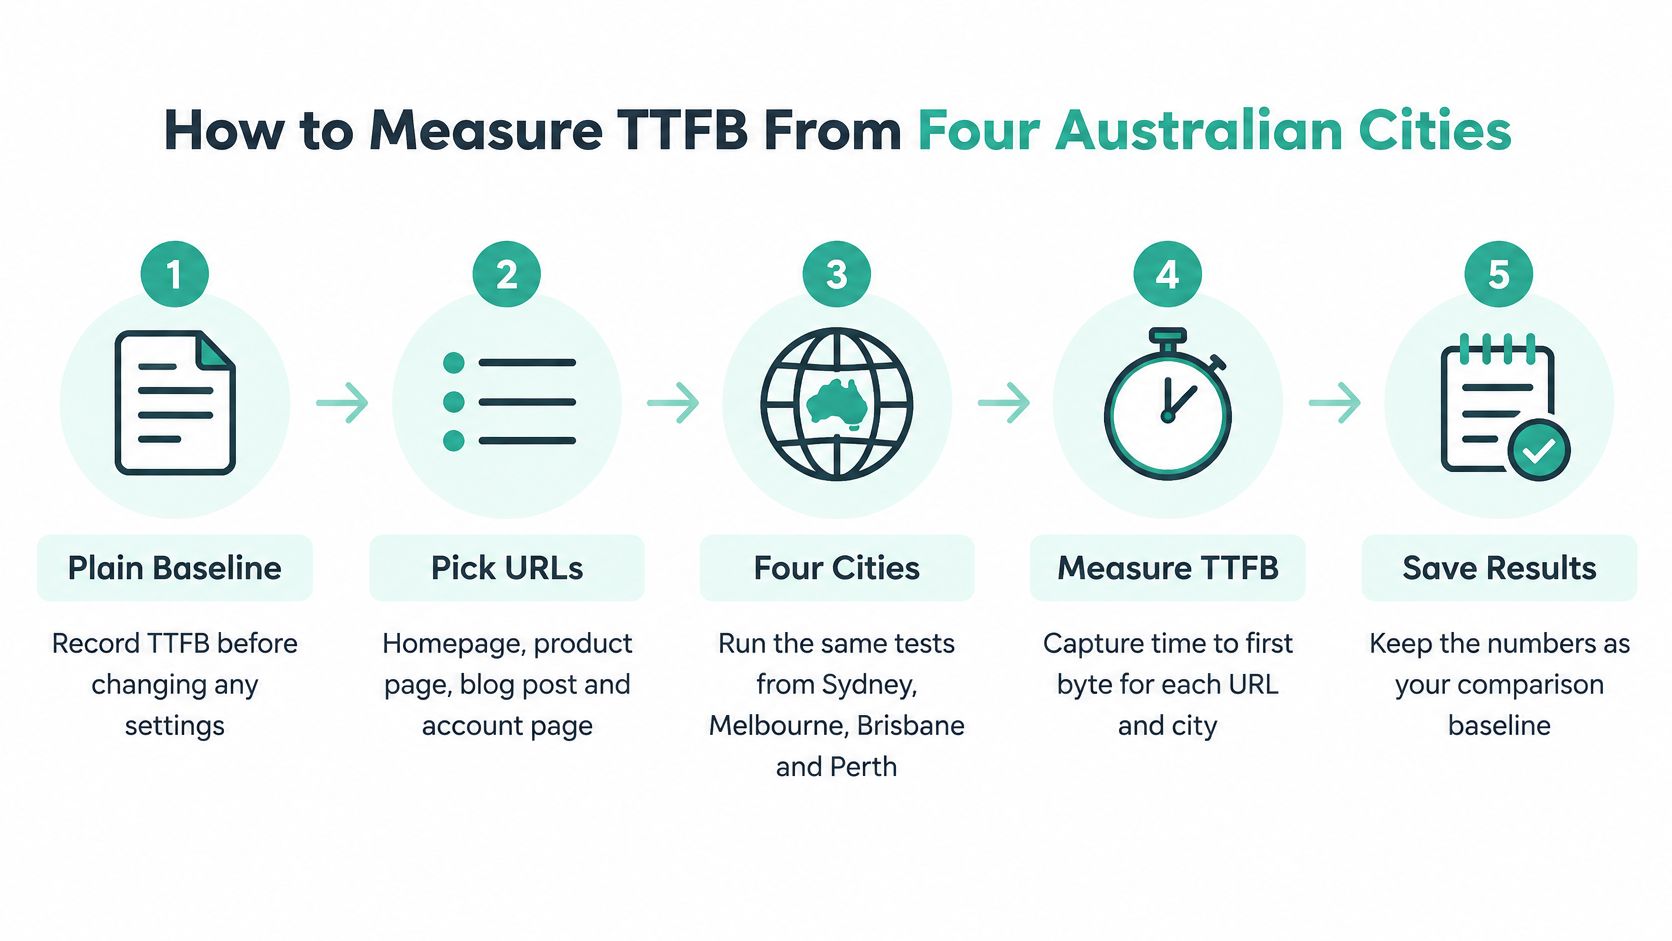
Change nothing until you have a plain baseline. Pick three to five URLs: the homepage, a service or product page, a blog post, and one form or account page. Those four shapes cover cached marketing pages and the dynamic work a CDN cannot hide.
Run the same test, then split the numbers
- Run WebPageTest or Lighthouse on each URL from Sydney, Melbourne, Brisbane and Perth, with the same browser and connection profile in every city. A single overseas node hides the path your customers use.
- Repeat the runs across seven days, covering weekday business hours and the evening peak. One quiet morning can hide congestion that shows up after 5 pm.
- Record DNS lookup, TCP and TLS, TTFB and Largest Contentful Paint as separate numbers. A Sydney measurement study found a 287 ms median TTFB across 20 popular sites, plus an extra 216 ms first-byte delay when a site was hosted outside its home region. Webpage loading still blends download, latency and DNS, so do not treat TTFB as the whole result.
- Run each URL twice, once with the cache cleared and once warm. You need both cached and uncached TTFB, or you will "fix" a page that was only fast because it was already stored.
- Decide which layer owns the delay: DNS, the network connection, application code, or the database. Write that owner next to the URL before you touch a setting.
- Save the sheet with the same URLs, cities and time windows. Every later change is compared with that sheet, not with a fresh lab run.
Testing only from Sydney, or only with an empty cache, hides the slower paths. Regional visitors and cache misses are where complaints start.
If DNS is the slow number and TTFB after the lookup is fine, point the domain at a responsive Australian resolver, drop an overseas-only nameserver, and retest DNS from all four cities before you touch PHP. If first byte matches an out-of-region origin, place the application and database in the same Australian region, turn on keep-alive, HTTP/2 or HTTP/3, and Brotli, then repeat the four-city run. The guide to testing website performance shows how to read those TTFB splits in WebPageTest or Lighthouse.
Host your website with our 5-star rated, cPanel website hosting plans.
Super fast servers, with security included and hosted in your choice of Australian Data Center.
View cPanel Plans
Server-Side Fixes for PHP, Caching and Resource Limits
Work down the stack and change one layer at a time. A plugin purge on the same afternoon as a PHP upgrade leaves you guessing which change moved TTFB.
PHP and the opcode cache
Move to a currently supported PHP 8.x release, and test plugins on a staging copy first. Older plugins sometimes fail on newer PHP, and a white screen costs more than a slow page. Confirm OPcache is enabled with enough memory that compiled scripts stay cached between requests. Without that, every hit recompiles the same files and uncached TTFB stays high even when the queries are reasonable.
What anonymous visitors should never wait for
On LiteSpeed hosting, use LSCache for full-page caching of anonymous visitors. Exclude cart, checkout and logged-in areas so a personal page is never served to the wrong person. AccelerateWP can add page and object caching plus image lazy-loading, which cuts repeated database work on the pages that still miss the full-page cache. Leave Brotli or gzip on, and keep HTTP/2 or HTTP/3 active. Compression shrinks the response. The newer protocols stop the browser opening a fresh connection for every file.
Check CloudLinux CPU and memory caps for the account. A site that hits its cap is throttled, so it answers slowly or times out under load even when the code is unchanged. Finish with a plugin audit and remove anything unused. Each active plugin adds work to every uncached request.
The checks worth making, and how to confirm them, are covered in PHP performance tuning.
| Layer | Setting to check | Expected effect |
|---|---|---|
| PHP version | Current PHP 8.x, plugins tested on staging | Faster script execution without broken plugins |
| OPcache | Enabled with adequate memory | Compiled scripts reused, less work on each request |
| Page cache (LiteSpeed LSCache) | Cache anonymous pages; exclude cart, checkout and logged-in users | Cached TTFB in the 200-300 ms range |
| Object cache (AccelerateWP) | Page and object caching enabled, plus image lazy-loading | Fewer database round trips on uncached pages |
| Compression and protocol | Brotli or gzip, with HTTP/2 or HTTP/3 left on | Smaller responses and fewer connection stalls |
| CloudLinux limits | CPU and memory caps checked per account | Removes throttling that causes slow responses and time-outs |
A cache that cannot be excluded from checkout is not a performance win. It is a wrong-page bug waiting for a logged-in customer.
Database and Application Queries That Stall Responses
Most uncached delay sits in a handful of queries, not in the theme as a whole. Australian visitors feel that wait hardest on mobile. An Australia-and-New-Zealand benchmark found average mobile load time of 9 seconds, rising to 15 seconds when backend loading was included, against a recommended target of 3 seconds, in Google's Australian mobile research. The same benchmark reported that a focus on mobile design and optimisation lifted site speed and performance by 19%, while a national site-performance score of 63.2/100 stayed constrained by mobile loading. A green desktop Lighthouse run does not clear that gap.

One loop that quietly multiplies
Enable the slow query log with a threshold around 200 ms, or use Query Monitor on WordPress and list query count and time per page. The usual culprit is an N+1 query. Say a category page shows 40 products and, inside the loop, runs a separate meta lookup for each one. That is 40 round trips instead of one joined query. The page is not "database heavy" in general. It is chatty.
Then work the short list, in order:
- Find the slowest pages. Sort by uncached TTFB during weekday traffic, not by plugin count.
- Name the query. Look for repeated lookups, missing indexes on frequent WHERE and ORDER BY columns, and a bloated set of autoloaded options, which WordPress loads on every uncached request.
- Fix the loop or add the index. Cache expensive results that change rarely. Move slow external API calls out of the render, either by storing the result or loading it after the page has appeared.
- Retest uncached TTFB. Stop when you hit your target. Chasing a perfect number after checkout already feels quick wastes the afternoon.
Set a server budget near 200-300 ms TTFB for cached pages and a 3 second page budget on a representative 4G profile, then verify on Australian mobile networks. Defer non-critical JavaScript and resize images only after the query is gone, or you will polish the front end while the database still holds the first byte. If the slow queries are a hosting limit rather than a missing index, the notes on database hosting are the next place to look.
When a CDN Helps and When Local Hosting Wins
A CDN helps only when every visitor can receive the same response. Images, CSS, JavaScript and cached full pages can come from a nearby copy, which cuts distance and download time. Logged-in WordPress pages, cart and checkout, form posts and API calls still wait on origin PHP or application code and the database. The edge copy does nothing for them.
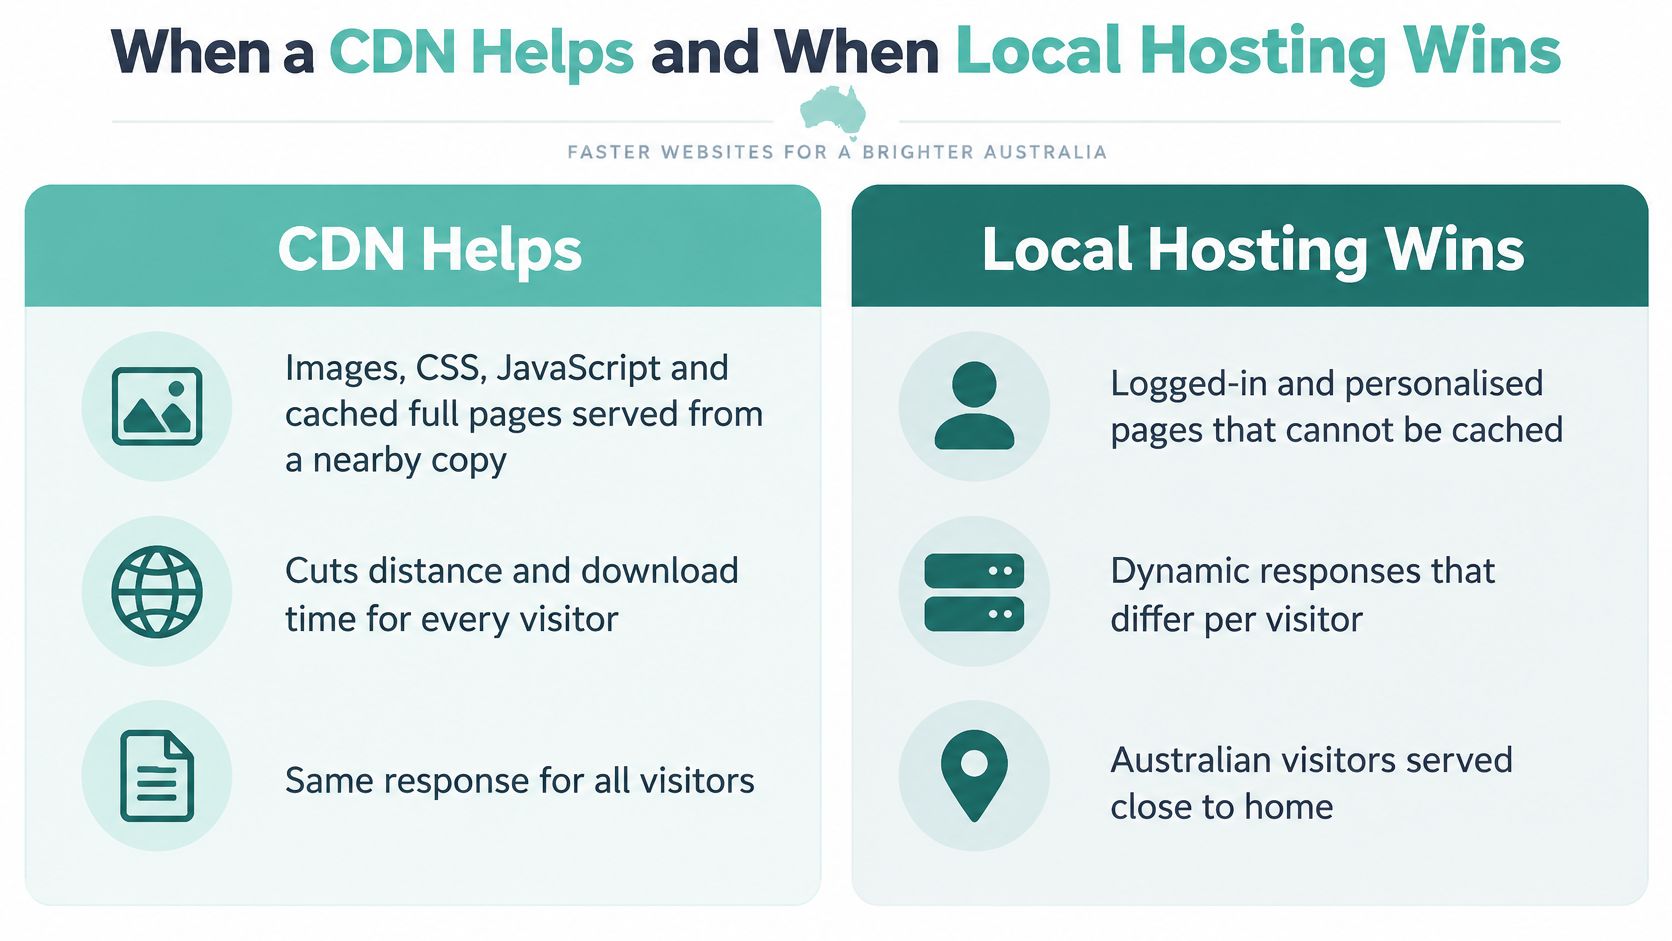
An ACCC web-performance study found that a website hosted in Australia can load much faster for Australians than an equivalent site hosted in the United Kingdom. Average time to first visual content was 1.9 seconds and 2.0 seconds on the two reference sites, and visual completion averaged 2.9 and 2.7 seconds, in the ACCC web performance test report. Use that as evidence that location matters, not as your TTFB target. A high TTFB points at execution, queries, DNS or distance. A low TTFB with slow visual completion points at images, JavaScript or CSS.
For a site aimed at anyone in Australia, Sydney is the best server location option. Still prove it. Repeat tests from Sydney, Melbourne, Brisbane and Perth rather than assuming one capital suits every visitor. Our low latency hosting in Australia is the place to compare an Australian origin with edge caching, because those two jobs are not the same.
| Request type | Cacheable at the edge? | Where the time goes | What to measure |
|---|---|---|---|
| Images, CSS and JavaScript | Yes | Download and rendering | Largest Contentful Paint and page weight |
| Cached full pages for anonymous visitors | Yes | Network distance to the nearest copy | Cached TTFB from four cities |
| Logged-in WordPress pages | No | Origin PHP and database | Uncached TTFB |
| Cart, checkout and form submissions | No | Origin processing and database writes | Uncached TTFB and error rate |
| API calls and application requests | No | Origin application and database queries | Uncached TTFB under weekday load |
Compare cached TTFB, which a CDN or full-page cache can move, with uncached TTFB, which moves only after origin code, database work or a closer host. If uncached TTFB stays high, keep the Australian origin and the server fixes. Adding another edge layer will make the logo faster and leave the checkout where it was.
Register your new domain name at competitive market prices including free domain add-ons like privacy, DNS Hosting, Custom Nameservers and Forwarding.
Always the best price and no nasty renewal price hikes.
Register A Domain Name
Confirm the Fix Holds Before You Call It Done
Judge every change against the same URLs, four cities and time windows as the baseline. A 3 am pass does not prove the evening peak.

- Snapshot files and the database before a large change. A full server image lets you roll back to that state in minutes if the deploy goes wrong.
- Change one layer at a time. Cache and PHP first, then queries. Two changes in one afternoon make a regression impossible to attribute.
- Retest cached and uncached TTFB and Largest Contentful Paint from Sydney, Melbourne, Brisbane and Perth on a mobile 4G profile during weekday busy hours.
- Hold the result against the opening table: cached TTFB around 200-300 ms, a full mobile load near 3 seconds, and your own seven-day baseline. A desktop Lighthouse gain is not enough while mobile visitors are still waiting on the backend.
- Keep the change only when uncached TTFB falls and the homepage, a content page, checkout and forms still work.
- If uncached TTFB stays high, check account CPU and memory caps and whether the origin sits outside Australia.
Match what you measured to the live stack. UpTime Cloud uses LiteSpeed and NVMe storage, with CPU and RAM that are not shared with other sites. cPanel hosting runs LiteSpeed Enterprise with LSCache on CloudLinux OS Shared Pro. After that check is live, run one more four-city test. Ongoing checks belong in website performance monitoring, using the same URLs you saved on day one.
UpTime Web Hosting runs Australian servers in Sydney, Melbourne, Brisbane and Perth, with LiteSpeed, CloudLinux and caching aimed at the server wait this guide separates from DNS and the visitor's network. If your four-city sheet still shows a slow origin after the cache and query fixes, that is a hosting problem, not a bandwidth one. Visit UpTime Web Hosting to put the site on local infrastructure and measure the difference from the same four cities.